BNB Analysis! Will it Start its Rise from the Critical Support Zone?
BTC/USDT
$20,984,476,382.66
$81,718.73 / $78,659.00
Change: $3,059.73 (3.89%)
+0.0002%
Longs pay

Contents
- While Bitcoin and altcoins have been experiencing upward movements since the beginning of March, BNB coin, one of the major coins, has not yet experienced a rally.
- Will BNB initiate an upward trend? We are sharing the current BNB analysis with you.
- Where should BNB investors pay attention?
Medium-Term BNB Price Analysis!
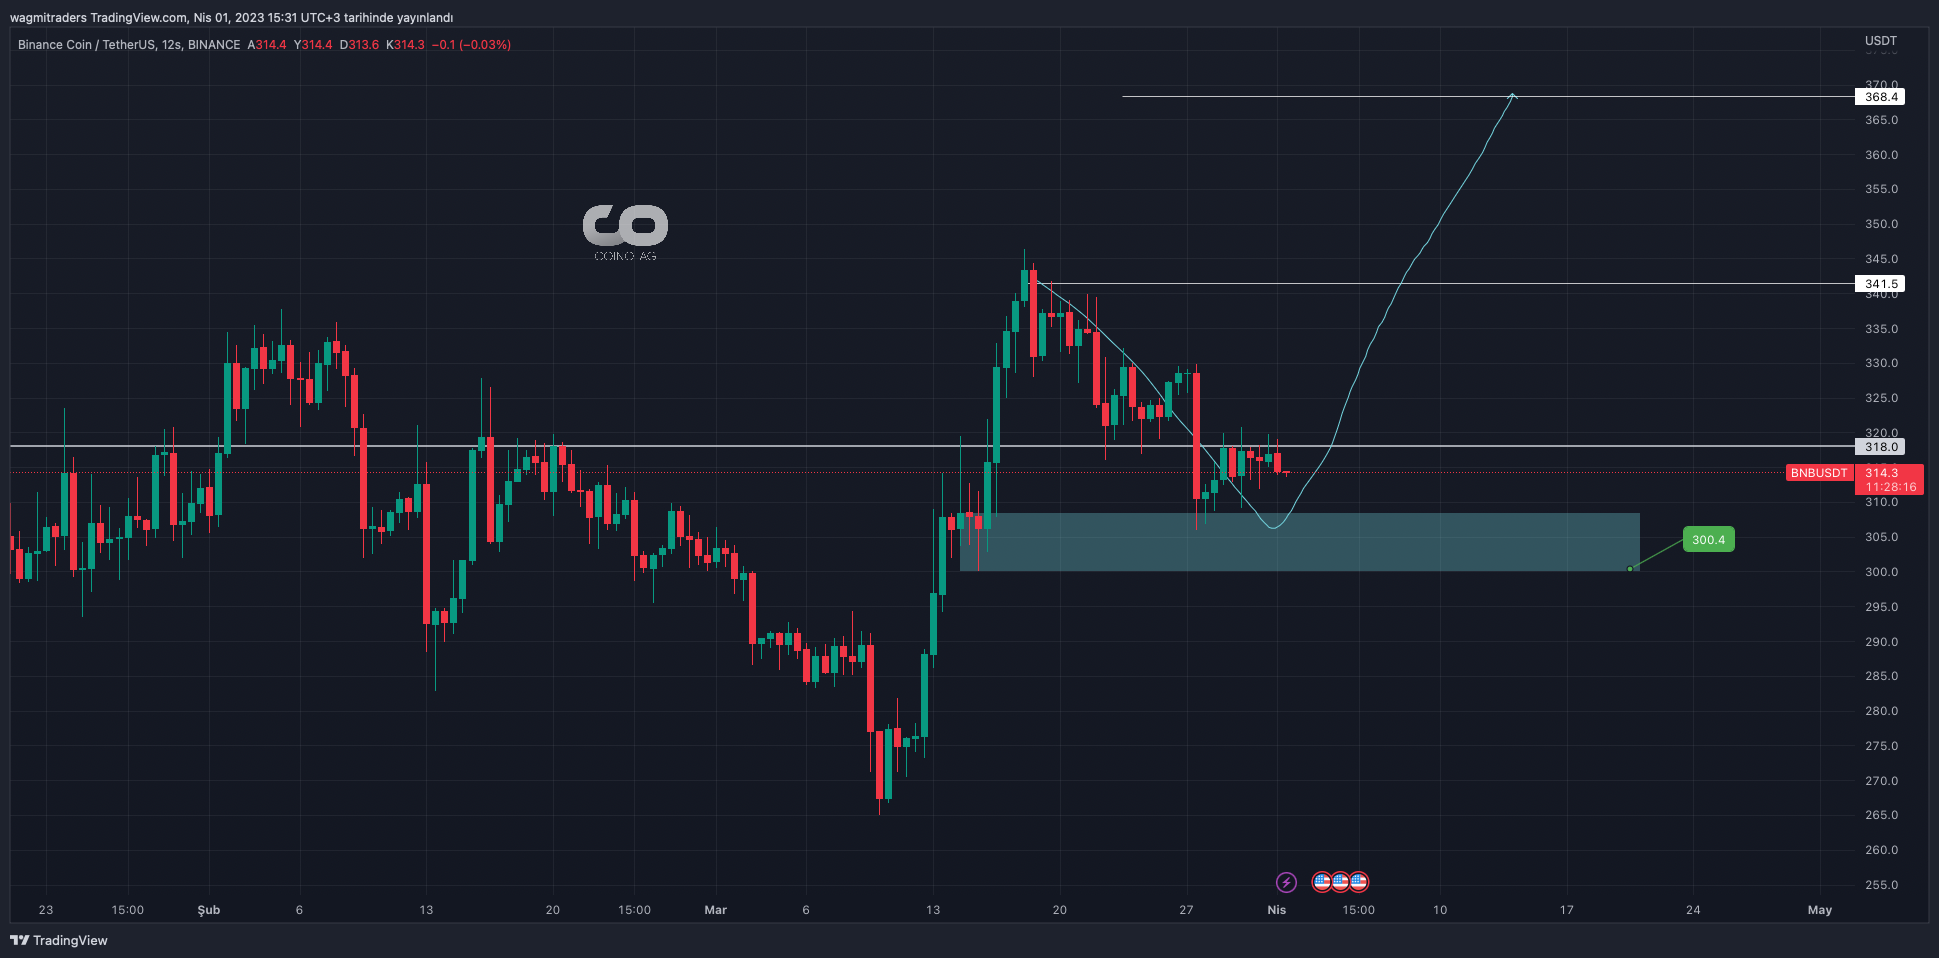
12-Hour BNB Price Graph Source: TradingView
Looking at the Binance Coin (BNB) price graph, it can be seen that it received support from the important support range of $300 – $305.
As long as the BNB price stays above $300, it can make an upward movement towards the resistance levels mentioned in the analysis.
As long as the BNB price stays above the mentioned support range, its first target will be the $341 level. If BNB closes below the $300 support level for a 12-hour candle, it can make a downward movement towards the $285 levels.
Short-Term BNB Price Analysis!

2-Hour BNB Price Graph Source: TradingView
When we examine the short-term graph of BNB price, it is moving close to the critical resistance level of $318.
If the Binance coin (BNB) price closes above the $318 level for 2-hour candles, it can continue its upward movement. As long as it stays above the $318 level, it may want to rise to the levels mentioned in the analysis, up to $328.
The closest support range for BNB in the short-term graph is the $308 price level. As long as the BNB price stays above $308, it can continue its upward movement.
Add COINOTAG as a Preferred Source
Add COINOTAG to your preferred sources in Google News and Search to see our coverage first.
Add on GoogleRelated Tags
Comments
Other Articles
LTC MWEB Vulnerability: 13 Block Reorg and Market Impact
April 28, 2026 at 05:32 AM UTC
Bitwise Files for 11 Altcoin ETFs Including AAVE, UNI Amid SOL, XRP Muted Gains
December 31, 2025 at 08:47 PM UTC
16 Top Altcoins Outperform Bitcoin Over 90 Days as Altcoin Season Index Drops to 16
December 28, 2025 at 08:41 AM UTC