Can Bitcoin Price Show a Rapid Recovery in the Near Future?
BTC/USDT
$17,272,160,469.17
$68,476.22 / $66,621.06
Change: $1,855.16 (2.78%)
+0.0011%
Longs pay
Contents
- After a price correction a few days ago, Bitcoin’s price preferred a sideways movement and the trend remained less volatile. This could be attributed to market conditions, but a turnaround seemed possible in the near future.
- Throughout last week, BTC’s price chart was a straight line and the price only changed marginally. According to data, BTC is currently trading at $26,076 and has a market value of over $506 billion.
- Looking at BTC’s on-chain data, it was observed that the supply on exchanges decreased while the supply outside of exchanges increased, indicating that investors were buying BTC.
Bitcoin price continues its sideways movement, but a breakout may be imminent for BTC; Current metrics indicate a change.
Bitcoin Price Continues Sideways Movement
After a price correction a few days ago, Bitcoin’s price preferred a sideways movement and the trend remained less volatile. This could be attributed to market conditions, but a turnaround seemed possible in the near future. This could be interpreted as several metrics having a bullish outlook on BTC.
Throughout last week, BTC’s price chart was a straight line and the price only changed marginally. According to data, BTC is currently trading at $26,076 and has a market value of over $506 billion. However, investor interest in trading was also low as weekly trading volume decreased by over 40%.
An interesting metric to consider when discussing price is trading volume, as it directly represents network activity. Looking back, it showed that every time the metric increased, there was an increase in Bitcoin’s price.
For several months, BTC’s total transfer volume remained relatively flat. Similar events had occurred in 2015 and 2020. After these events, the metric had increased. Therefore, the likelihood of a similar situation occurring again was high, which led to a promising outlook for a bullish rally for BTC in the near future.
Are the winds of change blowing for Bitcoin?
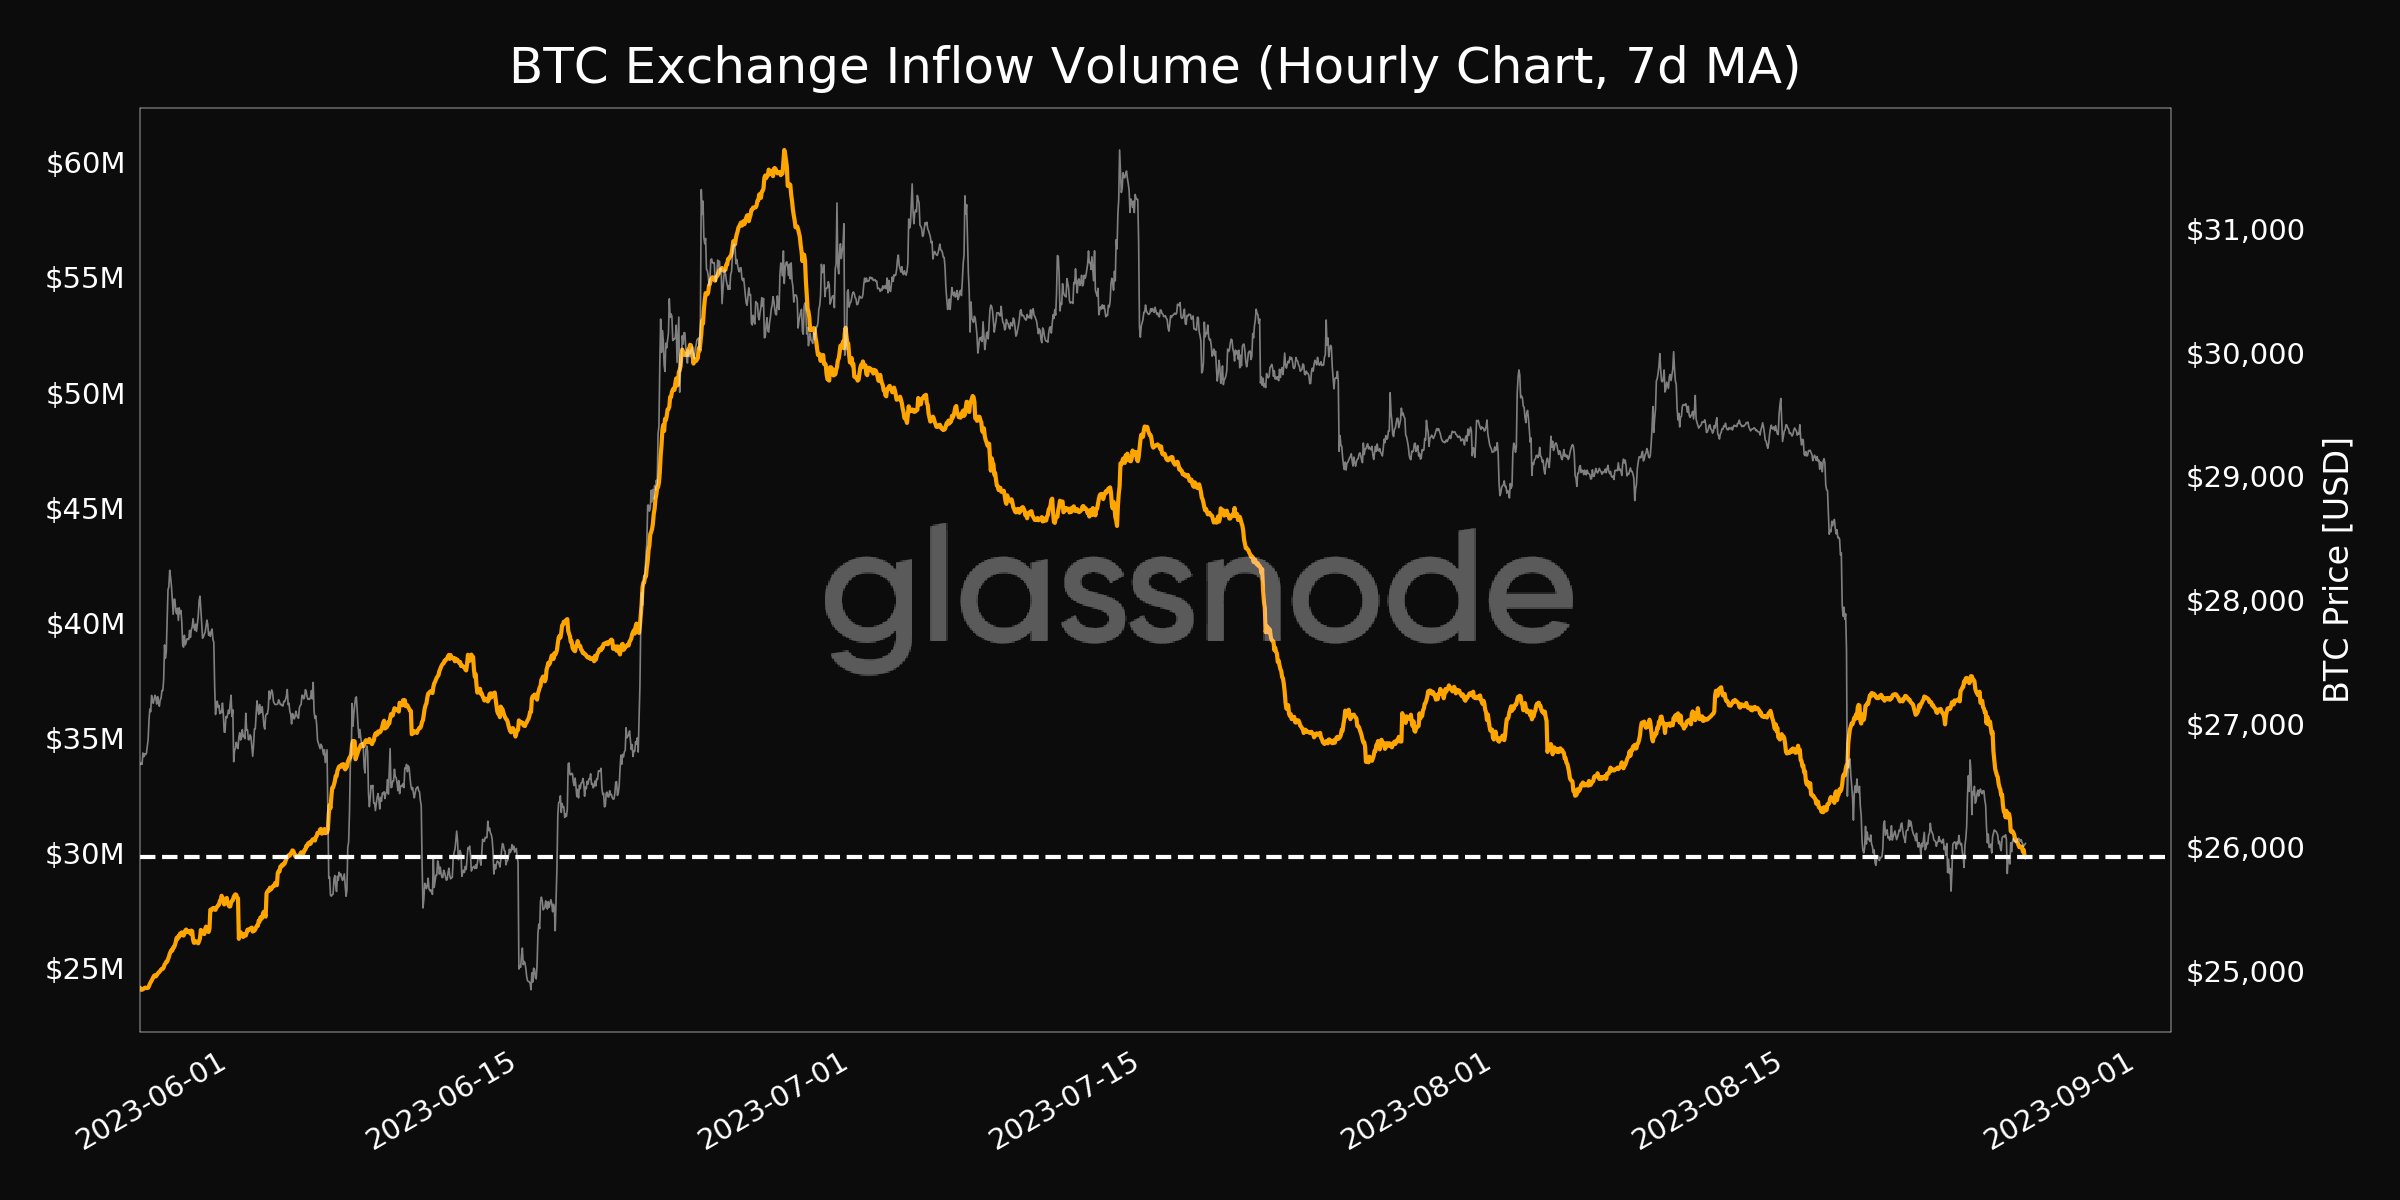
The likelihood of BTC’s total transfer volume graph increasing seemed to indicate bullish signals for BTC, as many other metrics did. For example, it was noted in a Glassnode Alerts post that BTC’s exchange inflow volume reached a monthly low of $29,838,347.22 on August 28th.
This meant that many investors were not depositing their tokens into exchanges at the moment. It also indicated low selling pressure and increased the likelihood of price increases. Additionally, the confidence of whales in BTC remained high, as evidenced by the fact that the number of Bitcoin whales reached a monthly peak of 1,608 individuals.
Looking at BTC’s on-chain data, it was observed that the supply on exchanges decreased while the supply outside of exchanges increased, indicating that investors were buying BTC.
The Bitcoin MVRV Ratio also improved in the past week, which was considered a bullish signal. According to Coinglass data, open positions decreased while BTC’s price was moving sideways. The decrease in this metric usually indicates a trend reversal, indicating an expectation of price increases in the near future.


