Altcoins Test Multi-Year Structure as ETH/BTC Eyes Rebound Amid Liquidity Shifts
ETH/USDT
$31,047,650,067.90
$2,386.02 / $2,174.06
Change: $211.96 (9.75%)
-0.0008%
Shorts pay

Contents
Altcoins are testing a multi-year ascending triangle pattern on the TOTAL2 chart, signaling potential breakout as buyers defend key support levels around $1.7 trillion, while ETH/BTC rebounds from macro lows and liquidity cycles hint at renewed expansion in the crypto market.
-
Altcoin market capitalization forms a long-term ascending triangle spanning 2017-2025, with higher lows indicating sustained buyer interest despite recent softness.
-
ETH/BTC pair retests a critical breakout zone after recovering from 0.02 support, echoing patterns from prior cycles that led to upward momentum.
-
Liquidity trends from Federal Reserve balance sheet expansions have historically driven altcoin rallies, with current consolidation potentially ending by December 2025 amid tightening phases.
Explore the altcoin market structure as ETH/BTC rebounds and liquidity shifts create opportunities. Discover key patterns and trends shaping crypto’s future—stay informed on emerging supports and potential breakouts today.
What is the Multi-Year Structure in the Altcoin Market?
Altcoin market structure reveals a prominent ascending triangle on the TOTAL2 monthly chart, spanning from 2017 to 2025, where higher lows connect major market bottoms including the 2020 COVID capitulation. This pattern highlights persistent buyer defense at progressively stronger levels, while a horizontal resistance near $1.7 trillion has capped prior expansions in 2021 and through 2024-2025. Recent price action tested this rising support after a failed breakout, maintaining the formation’s integrity amid overall market capitalization dipping to approximately $3.18 trillion.
How is ETH/BTC Performing in Relation to Altcoins?
The ETH/BTC weekly chart displays recurring cycles of decline and recovery, with Ethereum breaking above a bearish red band following a prolonged downtrend and now retesting a pivotal zone that historically preceded strong rallies. Long-term support at 0.02 has proven resilient, where buyers emerged in past downturns to fuel green expansion phases. Detailed analysis from market observers, including insights shared by @el_crypto_prof on X, suggests this retest could transition ETH/BTC into a new momentum phase, though failure might lead back to established lows, influencing broader altcoin dynamics.
Altcoins have captured significant trader attention amid mixed broader market signals, with multi-year patterns continuing to guide sector expectations. Detailed charts illustrate how these assets maintain structural resilience, even as total capitalization experiences mild declines. The ascending triangle on TOTAL2 underscores steady accumulation, as buyers repeatedly step in at elevated support lines.
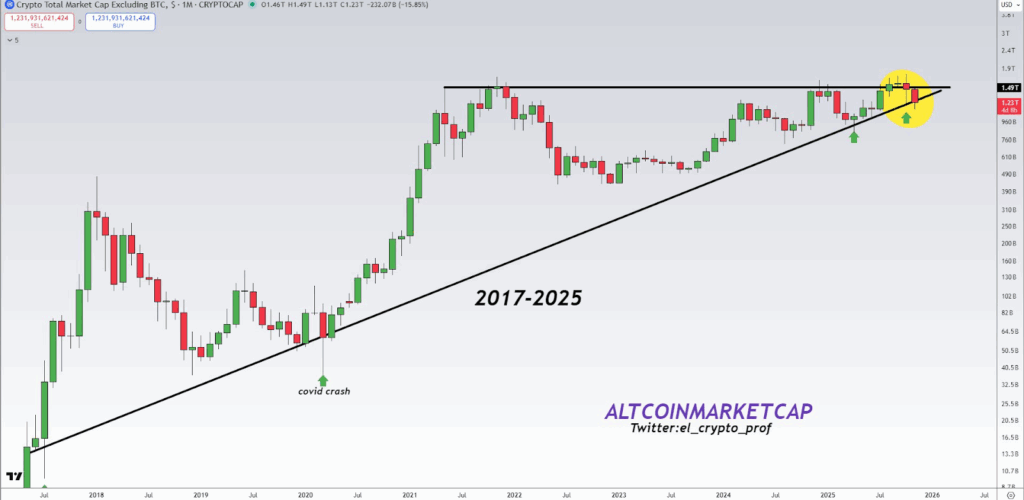
AltCoin MarketCap / Source: X
Defending the trendline remains crucial; a break below could undermine the bullish setup, yet current price action preserves the pattern. This development aligns with professional financial analysis emphasizing the importance of such long-term formations in volatile markets like cryptocurrencies.
How Do Liquidity Cycles Influence Altcoin Performance?
Liquidity cycles play a pivotal role in altcoin behavior, as evidenced by correlations between TOTAL2 and the Federal Reserve’s balance sheet expansions. Historical data shows altcoin rallies intensifying during periods of quantitative easing, such as the 2017-2018 boom and the 2020-2021 surge, when liquidity injections fueled broad market growth. In contrast, tightening phases have led to consolidation, with altcoins forming wide ranges and subdued advances, mirroring the current multi-year zone marked by dotted trendlines.
Expert commentary from sources like @el_crypto_prof on X highlights that the ongoing quantitative tightening may conclude around December 2025, potentially reigniting activity. This outlook is supported by observations of select tokens, including MovieBloc and pippin, posting notable gains despite a slight global market dip. Such patterns demonstrate how macroeconomic liquidity directly impacts crypto sectors, with balance sheet growth historically aligning with altcoin outperformance against Bitcoin.
The interplay between these cycles and altcoin charts reveals a maturing market, where consolidation precedes expansion. Traders monitor these trends closely, as shifts in liquidity could validate the ascending triangle’s breakout potential. Federal Reserve data underscores this linkage, showing past expansions correlating with over 300% gains in altcoin capitalization during key periods.
Frequently Asked Questions
What does the ascending triangle mean for altcoin market structure?
The ascending triangle in altcoin market structure indicates building bullish pressure through higher lows against a flat resistance, often resolving in an upside breakout after prolonged consolidation. Spanning multiple cycles since 2017, it reflects buyer commitment at key supports like the post-COVID lows, positioning altcoins for potential expansion if the $1.7 trillion barrier breaks decisively.
Will ETH/BTC rebound lead to altcoin gains?
Yes, an ETH/BTC rebound from the 0.02 support level often signals broader altcoin strength, as seen in previous cycles where Ethereum’s momentum pulled alternative assets higher. The current retest of a breakout zone, following recovery from macro lows, aligns with patterns that historically preceded rallies, though sustained defense above support is essential for confirmation.
Key Takeaways
- Resilient Altcoin Patterns: The multi-year ascending triangle on TOTAL2 maintains integrity with defended higher lows, suggesting accumulation despite market softness around $3.18 trillion capitalization.
- ETH/BTC Momentum Shift: Retesting prior breakout zones after 0.02 support recovery mirrors past cycles, potentially transitioning to green expansion if buyers hold firm.
- Liquidity-Driven Outlook: Ending quantitative tightening by December 2025 could spark altcoin activity, as historical balance sheet growth has consistently boosted sector performance—monitor for breakout signals.
Conclusion
The altcoin market structure, characterized by a robust ascending triangle and ETH/BTC’s critical retest, combined with evolving liquidity cycles, points to a sector poised for potential renewal amid 2025’s macroeconomic shifts. As buyers defend long-term supports and historical patterns repeat, investors should track these developments closely for emerging opportunities. With total capitalization holding steady, forward momentum in altcoins and Ethereum’s relative strength could drive the next phase of crypto growth—position yourself informed for what’s ahead.
Comments
Other Articles
Bitwise Files for 11 Altcoin ETFs Including AAVE, UNI Amid SOL, XRP Muted Gains
December 31, 2025 at 08:47 PM UTC
Ethereum Stablecoins Reach 2025 Peaks Led by USDT, Amid Sustained Activity
December 31, 2025 at 07:01 PM UTC
Ethereum Could Target $8,500 as Bullish Momentum Builds Near $4,811
December 31, 2025 at 02:39 PM UTC