ARB Shows Signs of Recovery with Major Inflows and Calmer Liquidation Trends

Contents
ARB has experienced $25.8 billion in net inflows over the past three months, signaling strong market interest in its Layer-2 ecosystem. This surge, coupled with rising trading volume and reduced liquidation risks, indicates recovering confidence among traders and developers as liquidity shifts toward scalable blockchain solutions.
-
ARB records $25.8 billion in net inflows, outpacing competitors like Ethereum and Polygon amid growing Layer-2 adoption.
-
Trading volume surges by over 37%, supporting a 12% market cap increase as ARB stabilizes around $0.2170.
-
Liquidation patterns show a decline post-October volatility, with net liquidations dropping 40% in November, reflecting lower leverage and calmer market conditions.
Discover how ARB net inflows of $25.8B are driving Layer-2 growth and price recovery. Explore rising volumes and shifting liquidations in this detailed analysis—stay ahead in crypto trends today!
What Are ARB Net Inflows and Their Impact on the Ecosystem?
ARB net inflows represent the net capital entering the Arbitrum network, calculated as positive inflows minus outflows across exchanges and protocols. In the past three months, ARB has seen $25.8 billion in net inflows, highlighting its appeal as a leading Layer-2 scaling solution for Ethereum. This influx, driven by developer activity and user migration, positions ARB ahead of rivals and fosters ecosystem expansion through enhanced liquidity and transaction efficiency.
How Has the ARB Price Structure Evolved with Recent Market Activity?
The ARB price has demonstrated resilience, trading at $0.2170 amid a broader recovery from recent lows. Following a dip to $0.19 in line with market-wide pressures, the token rebounded with a weekly gain supported by a 37% rise in daily volume and a 12% market cap increase to over $1.2 billion. According to market data from sources like Coinglass, this uptick correlates with heightened participation, where the circulating supply of 5.61 billion ARB tokens bolsters stability. Expert analysts, such as those from DeFi research firms, note that such volume growth often precedes sustained rallies in Layer-2 assets, as it signals deeper market engagement rather than fleeting speculation.
Frequently Asked Questions
What Factors Are Driving the Recent ARB Net Inflows?
ARB net inflows are primarily fueled by increasing adoption of its Layer-2 ecosystem for faster, cheaper transactions compared to Ethereum mainnet. With $25.8 billion entering over three months, factors include developer incentives, dApp launches, and capital rotation from underperforming chains like Polygon and Avalanche, which saw outflows. This positions ARB as a go-to for scalable DeFi and NFT applications.
Why Are Liquidation Trends Shifting for ARB Traders?
Liquidation trends for ARB have shifted toward calmer waters after October’s volatility, with a 40% reduction in events during November as traders deleverage positions. This natural adjustment follows a spike in long and short liquidations near $0.40-$0.50 levels, allowing for repositioning at lower prices around $0.21. Such patterns indicate maturing market behavior, ideal for long-term holders seeking stability in Layer-2 investments.
Key Takeaways
- Strong Net Inflows: $25.8 billion in ARB inflows over three months underscore Layer-2 dominance, attracting developers and users away from congested networks.
- Price Recovery Momentum: With volume up 37% and market cap rising 12%, ARB’s stabilization at $0.2170 reflects genuine ecosystem growth, not just hype.
- Reduced Risk Exposure: Declining liquidations post-volatility encourage strategic positioning, advising traders to monitor upcoming catalysts like protocol upgrades for potential gains.
Conclusion
ARB net inflows continue to reshape the Layer-2 landscape, with $25.8 billion in recent capital underscoring its role in scalable blockchain innovation alongside price recovery and easing liquidation pressures. As market activity builds, this positions ARB for sustained growth in DeFi and beyond. Investors should track ecosystem developments closely to capitalize on emerging opportunities in the evolving crypto space.
ARB sees major inflows, rising volume, and shifting liquidation patterns as traders reassess risk and activity across the ecosystem.
- ARB posts large net inflows and renewed market interest as liquidity concentrates on Layer-2 ecosystems.
- ARB price shows recovery after recent lows, supported by rising volume and stronger participation.
- Liquidation trends point to reduced leverage and calmer conditions after October volatility.
ARB shows renewed strength as liquidity inflows, improving market activity, and calmer leverage conditions shape a shifting outlook. The data reflects notable movement across net flows, price action, and liquidation levels over recent months.
Net Flows Reflect Expanding Market Activity
ARB begins this cycle with large liquidity inflows that reshape the competitive landscape. Marc Shawn Brown shared that the network recorded $25.8B in net inflows during the past three months. This change places ARB ahead of other ecosystems, with traction building around developer growth and user participation.
🔥LATEST: $ARB saw $25.8B in net inflows over the past 3 months. pic.twitter.com/GJzcg2Z2uR
— Marc Shawn Brown (@MarcShawnBrown) December 3, 2025
These inflows separate ARB from chains showing mixed or negative movement. The strong position contrasts networks such as Ethereum Mainnet, Polygon PoS, and Avalanche C-Chain, which faced persistent outflows. The movement indicates broader market rotation toward scalable environments where high-activity applications continue to grow.
Other networks like Starknet, Solana, edgeX, and Ink also saw mild positive flows. Their results support user preference for alternative execution layers. Still, ARB maintains the largest expansion, placing it at the center of recent capital migration.
Price Structure Shows Recovery and Elevated Activity
ARB as of writing, trades at $0.2170 as the market responds to recent pressure and renewed momentum. The asset posts a weekly gain and sees increased trading activity, with market cap rising more than 12% and daily volume up more than 37%. These changes reflect stronger engagement rather than short-term volatility.
Price action shows a steady pattern before December, followed by a downturn toward $0.19. The decline aligned with broader market softness. ARB then moved upward with a clearer recovery, climbing back into the $0.21 zone where it currently stabilizes.
Volume growth supports the structure of this rebound. The rising participation indicates deeper liquidity returning to the market. With a circulating supply of 5.61B ARB and an FDV of $2.16B, activity continues to expand in parallel with renewed ecosystem traction.
Liquidation Trends Show Reduced Leverage Exposure
The liquidation chart displays modest activity through the summer months. Small long and short liquidations show a balanced market where traders maintained guarded exposure. Price movements during this period remained steady with minor directional shifts.
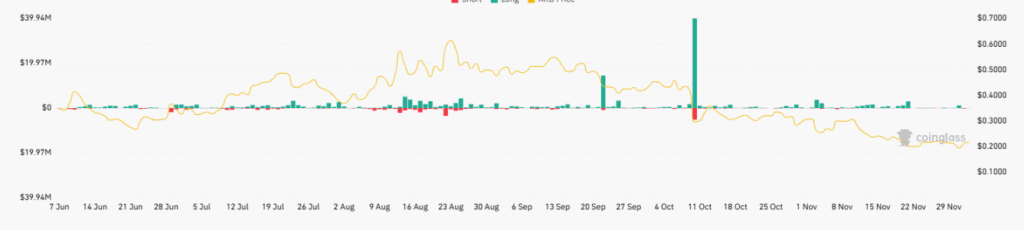
A major event appeared in early October, with a large long liquidation spike followed by a notable short liquidation. This rare pattern reflected high volatility and rapid market repositioning. The movement aligned with a sharp price adjustment near the $0.40–$0.50 range.
Since then, liquidation levels have eased. November showed smaller liquidations as traders reduced leverage and repositioned around lower price levels. The calmer environment suggests a market preparing for new catalysts with reduced risk exposure.
Add COINOTAG as a Preferred Source
Add COINOTAG to your preferred sources in Google News and Search to see our coverage first.
Add on GoogleRelated Tags
Comments
Other Articles
Arbitrum’s 2025 Inflows and Fundamentals May Signal ARB Price Rebound Near $0.19
December 29, 2025 at 03:10 AM UTC
LayerZero (ZRO) Leads This Week’s One-Time Token Unlock Worth $37.8M, Joined by Arbitrum (ARB), StarkNet (STRK) and Sei (SEI)
December 15, 2025 at 01:05 AM UTC
Ethereum’s DeFi Dominance May Be Eroding Amid Solana and Tron Gains
November 12, 2025 at 11:10 PM UTC