Bitcoin Bearish Signals Emerge with Fractal Pattern, Rebound Possible at $81,900 Support
BTC/USDT
$5,893,102,060.79
$67,284.00 / $65,766.10
Change: $1,517.90 (2.31%)
-0.0007%
Shorts pay

Contents
Bitcoin is showing signs of entering a bear market phase in 2025, with its price dropping to around $85,975 after a 7% correction over the past 24 hours. Technical indicators like repeating fractals and negative Delta Growth Rate suggest prolonged downward pressure, though the True Market Mean at $81,900 offers potential support for recovery.
-
Bitcoin has declined 7% in the last 24 hours, trading at $85,975, marking eight days below $100,000.
-
A repeating fractal pattern, which predicted the last three bear markets, indicates Bitcoin entered a bearish cycle about ten days ago.
-
96% of traders on Hyperliquid over the past six months are in losses, with taker sell volume reaching negative $92 million in the last day, per market data.
Bitcoin bear market 2025: Analyze the latest price correction and technical signals pointing to a potential prolonged downturn. Discover key support levels and recovery possibilities—stay informed for smarter crypto decisions.
Is Bitcoin Entering a Bear Market in 2025?
Bitcoin appears to be transitioning into a bear market phase in 2025, as evidenced by its recent price correction to $85,975 following a 7% drop in 24 hours. This marks the eighth consecutive day below the $100,000 level, with historical patterns like repeating fractals signaling the start of this cycle around ten days ago. While macroeconomic factors influence trends, Bitcoin’s decoupling at extremes suggests internal market dynamics are now driving the downward momentum.
What Technical Indicators Support a Bearish Outlook for Bitcoin?
A key technical signal is the repeating fractal pattern, which has reliably forecasted the previous three bear markets and now points to Bitcoin’s entry into a similar phase. This pattern emerges as the price forms successive lower lows, with data from Alphractal confirming the shift began approximately ten days prior. Supporting this, the Delta Growth Rate has turned negative, comparing market capitalization growth to realized capitalization and historically leading to sideways movement within a broader decline.
The derivatives market reinforces this bearish sentiment. Data from Hyperliquid shows that 96% of traders over the past six months are underwater, while the Taker Buy/Sell Ratio indicates dominant selling pressure, with taker sell volume hitting negative $92 million in the last 24 hours alone. Such metrics highlight reduced buyer support and increased risk of further breakdowns.
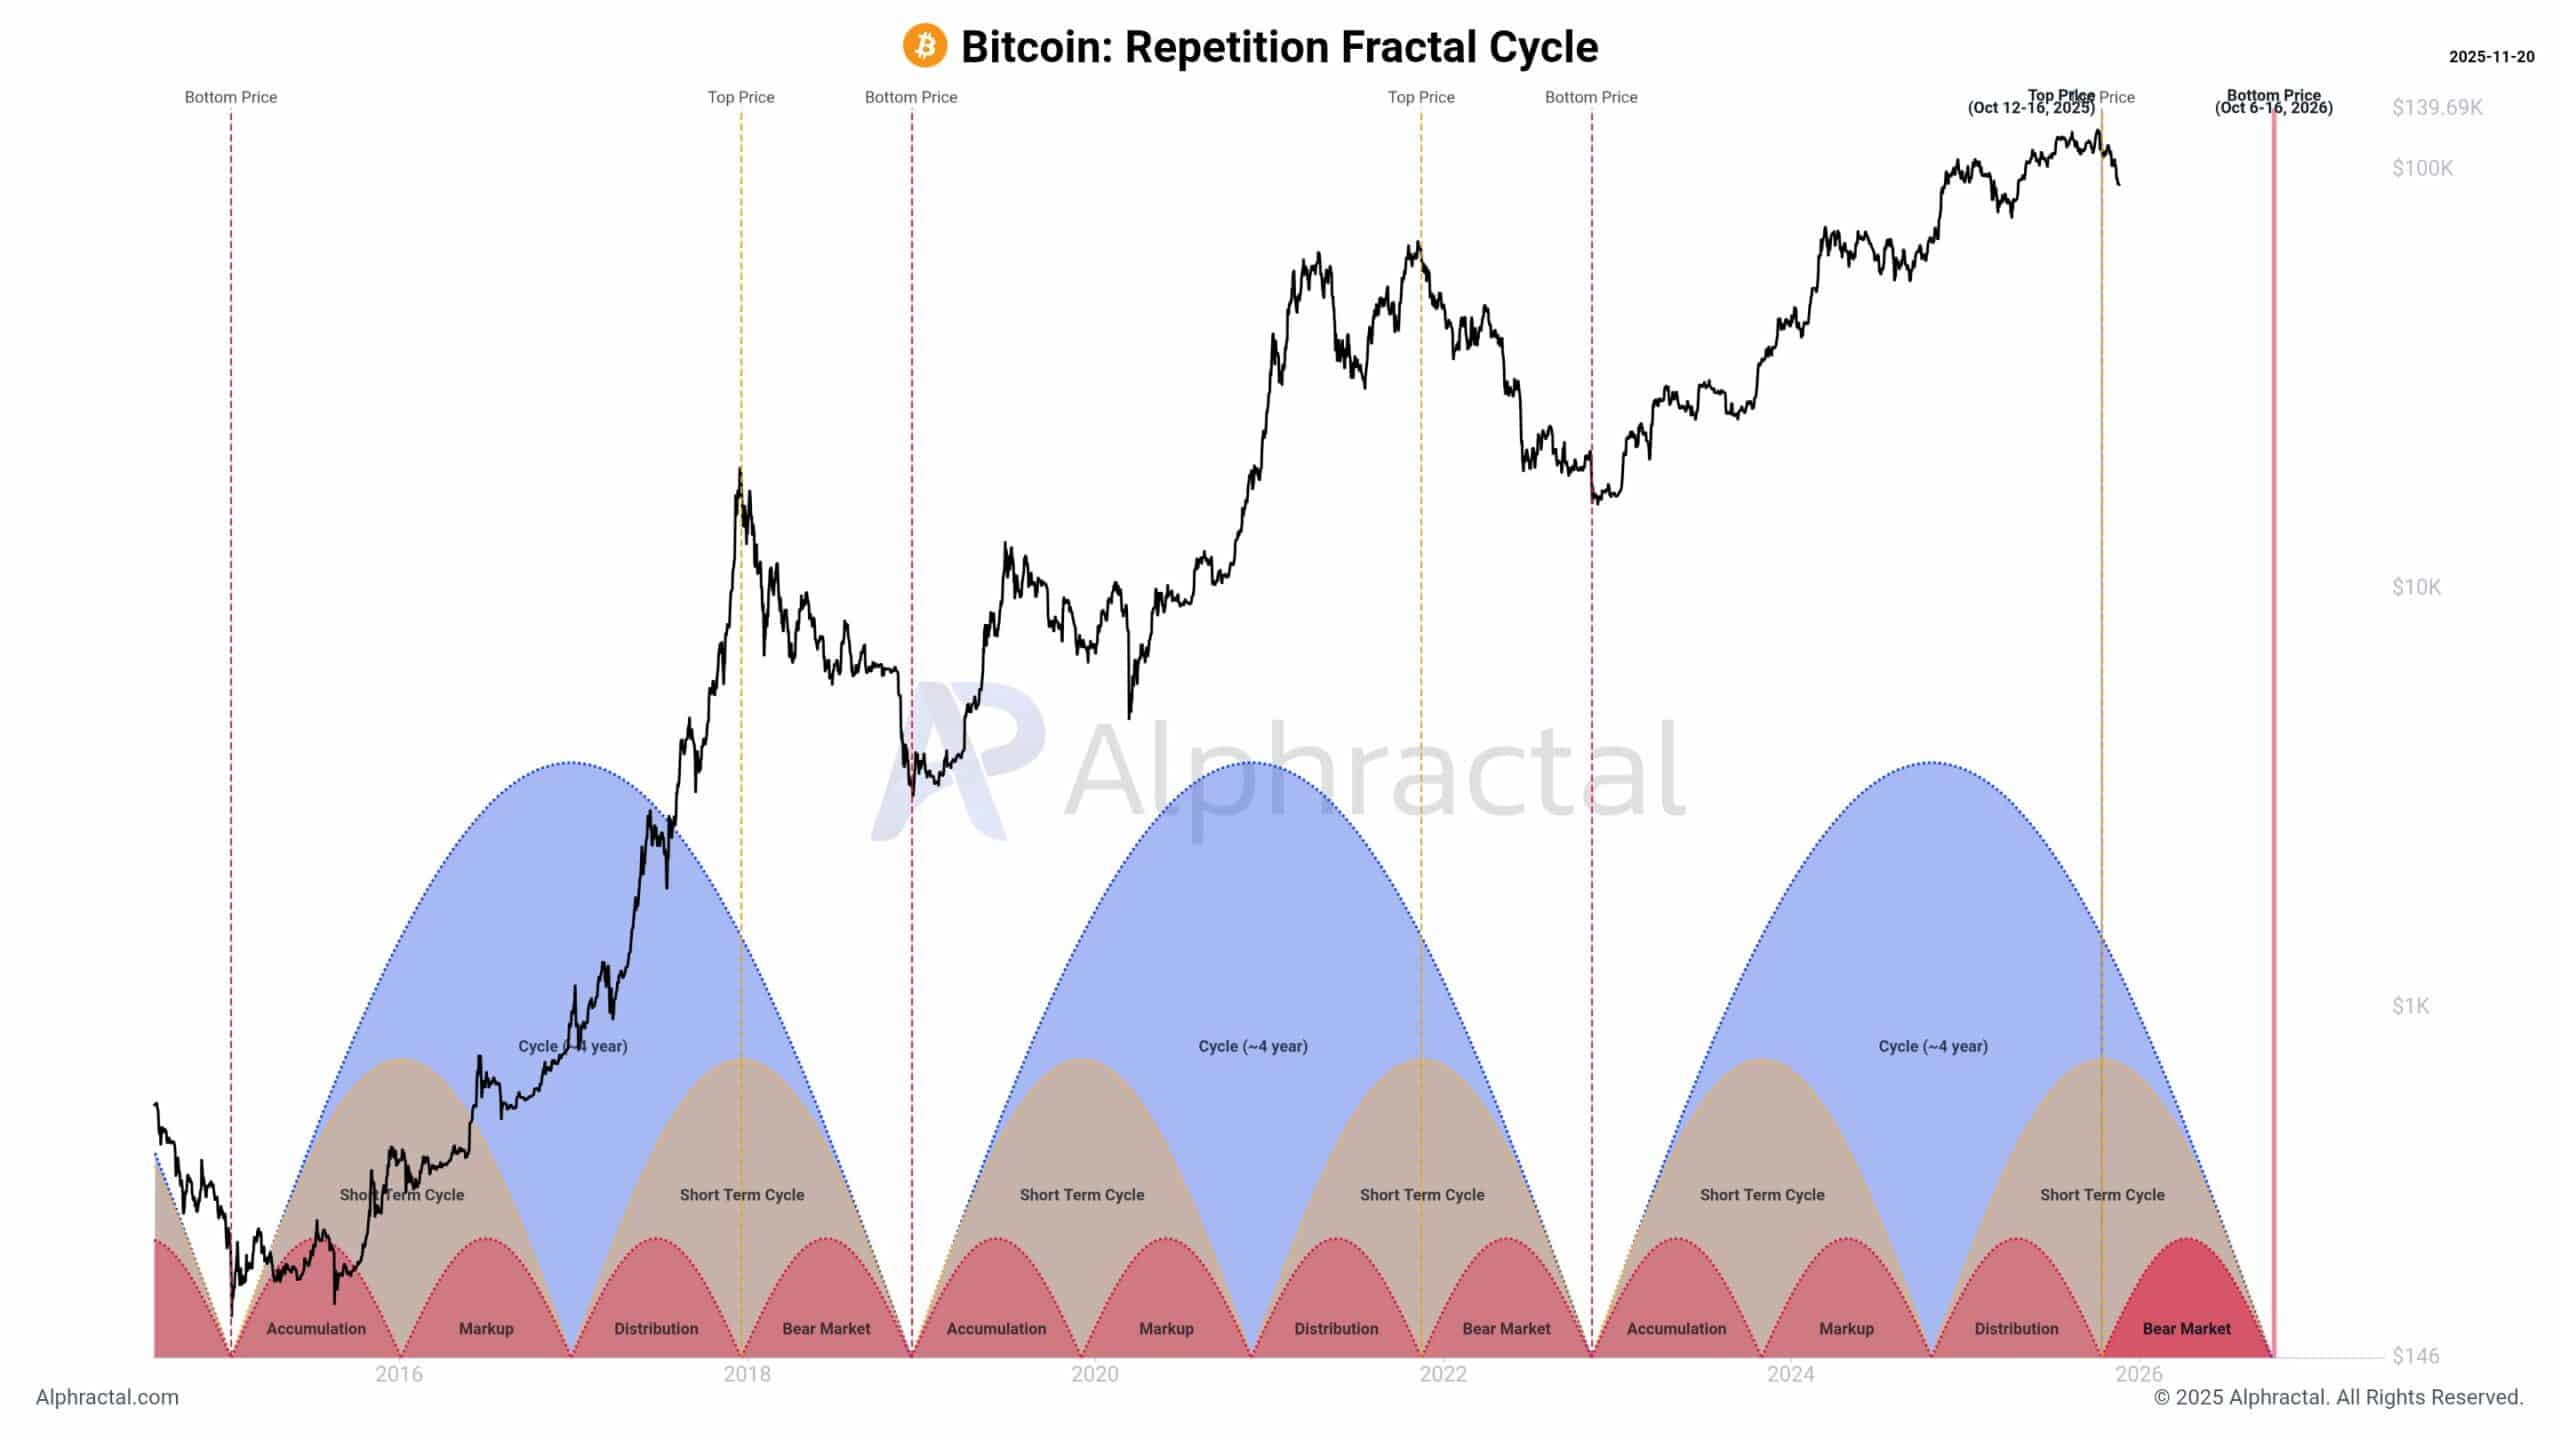
Source: Alphractal
Expert analyst João Wedson from Alphractal emphasized the role of market extremes in Bitcoin’s behavior: “When the price is at an ATH or at a historical bottom — in those extremes, Bitcoin completely breaks its correlation with traditional assets.” This decoupling is evident in the current decline, where buyers from the last 14 months face substantial losses, further eroding confidence.
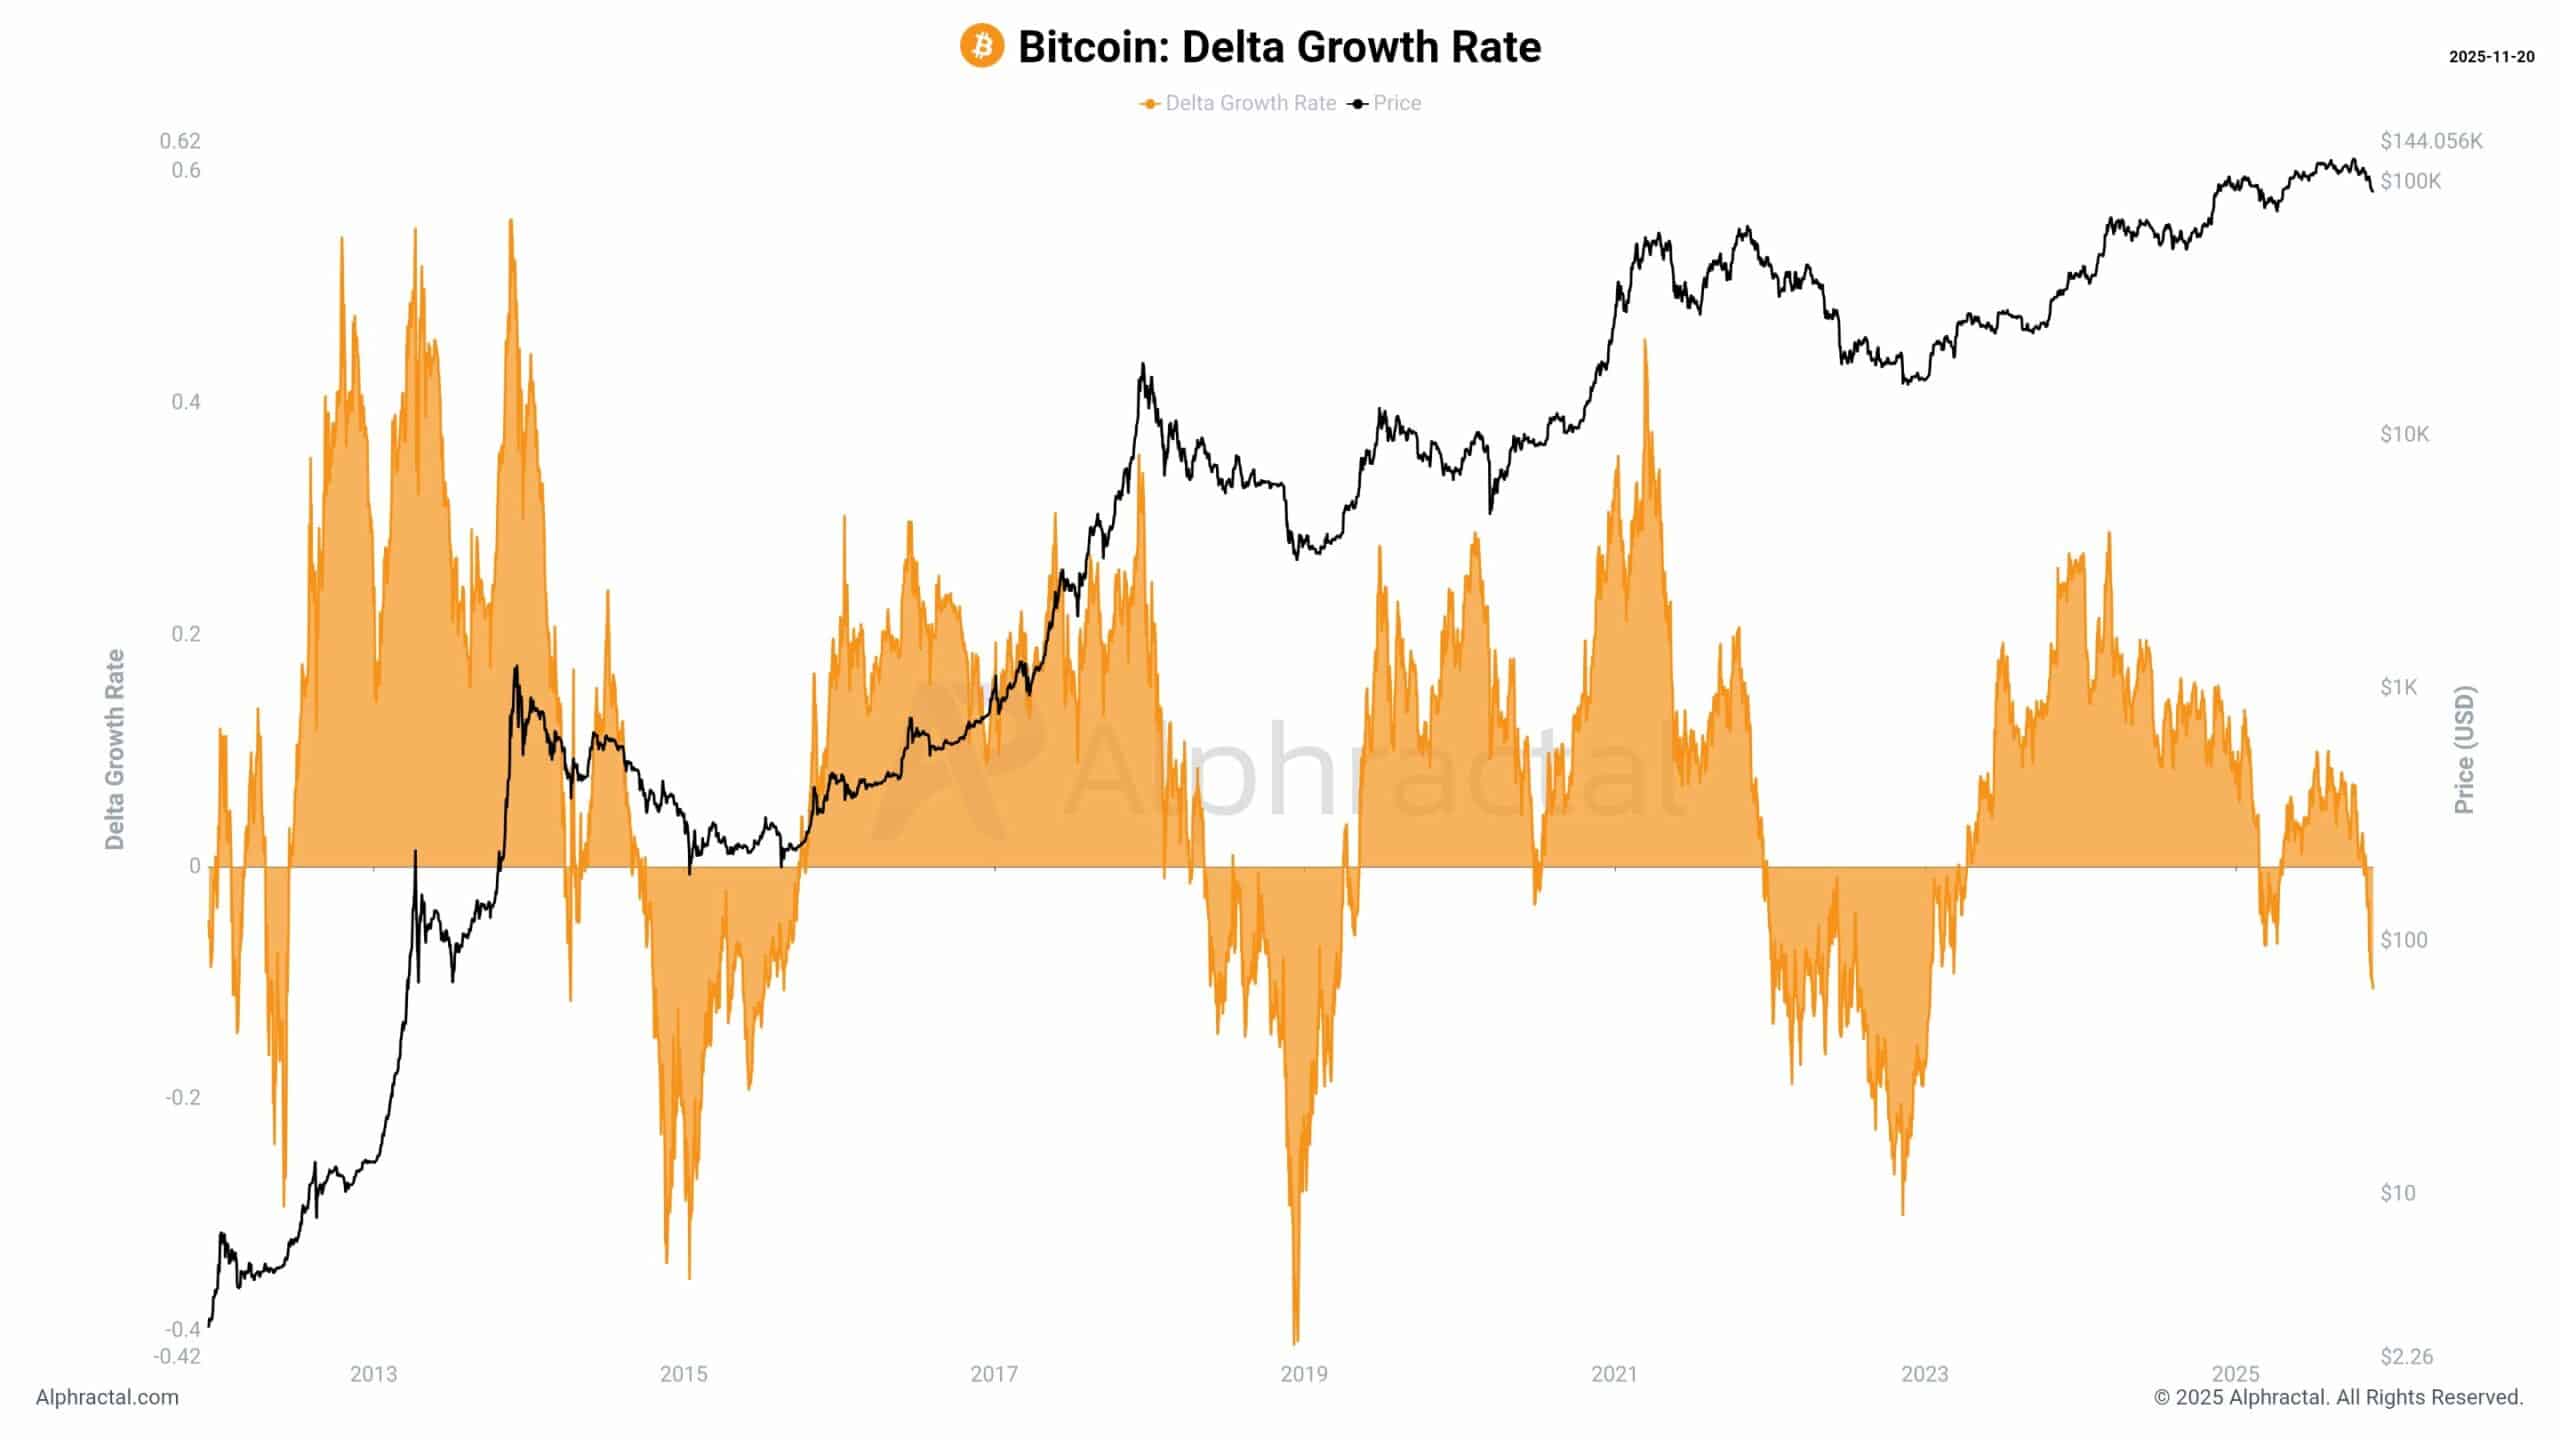
Source: Alphractal
Bitcoin has closed below the $100,000 threshold three times this year, but the current trajectory differs due to emerging bearish signals. At press time, after 46 days from its all-time high, the asset’s value underscores a sustained correction rather than a temporary dip.
Frequently Asked Questions
What is causing Bitcoin’s recent price drop to $85,000 in 2025?
Bitcoin’s drop to around $85,000 stems from a 7% correction over 24 hours, driven by technical indicators like fractal patterns and negative Delta Growth Rate. Selling pressure in derivatives markets, with 96% of Hyperliquid traders in losses, has amplified the decline, per Alphractal data.
Can Bitcoin recover from this bearish phase soon?
Recovery for Bitcoin hinges on holding the True Market Mean support at $81,900, which tracks average purchase prices across the market. A breach could lead to deeper corrections similar to 2023, but maintaining this level might limit the bear market to mild conditions, according to Glassnode metrics.
Key Takeaways
- Bitcoin’s Price Correction: The asset has fallen 7% to $85,975, spending 46 days from its all-time high and eight days below $100,000, signaling potential bear market entry.
- Technical Bearish Signals: Repeating fractals and negative Delta Growth Rate indicate prolonged downward or sideways movement, with historical accuracy in past cycles.
- Support and Recovery Potential: The True Market Mean at $81,900 acts as key support; holding it could prevent a severe bear phase and open doors for rebound.
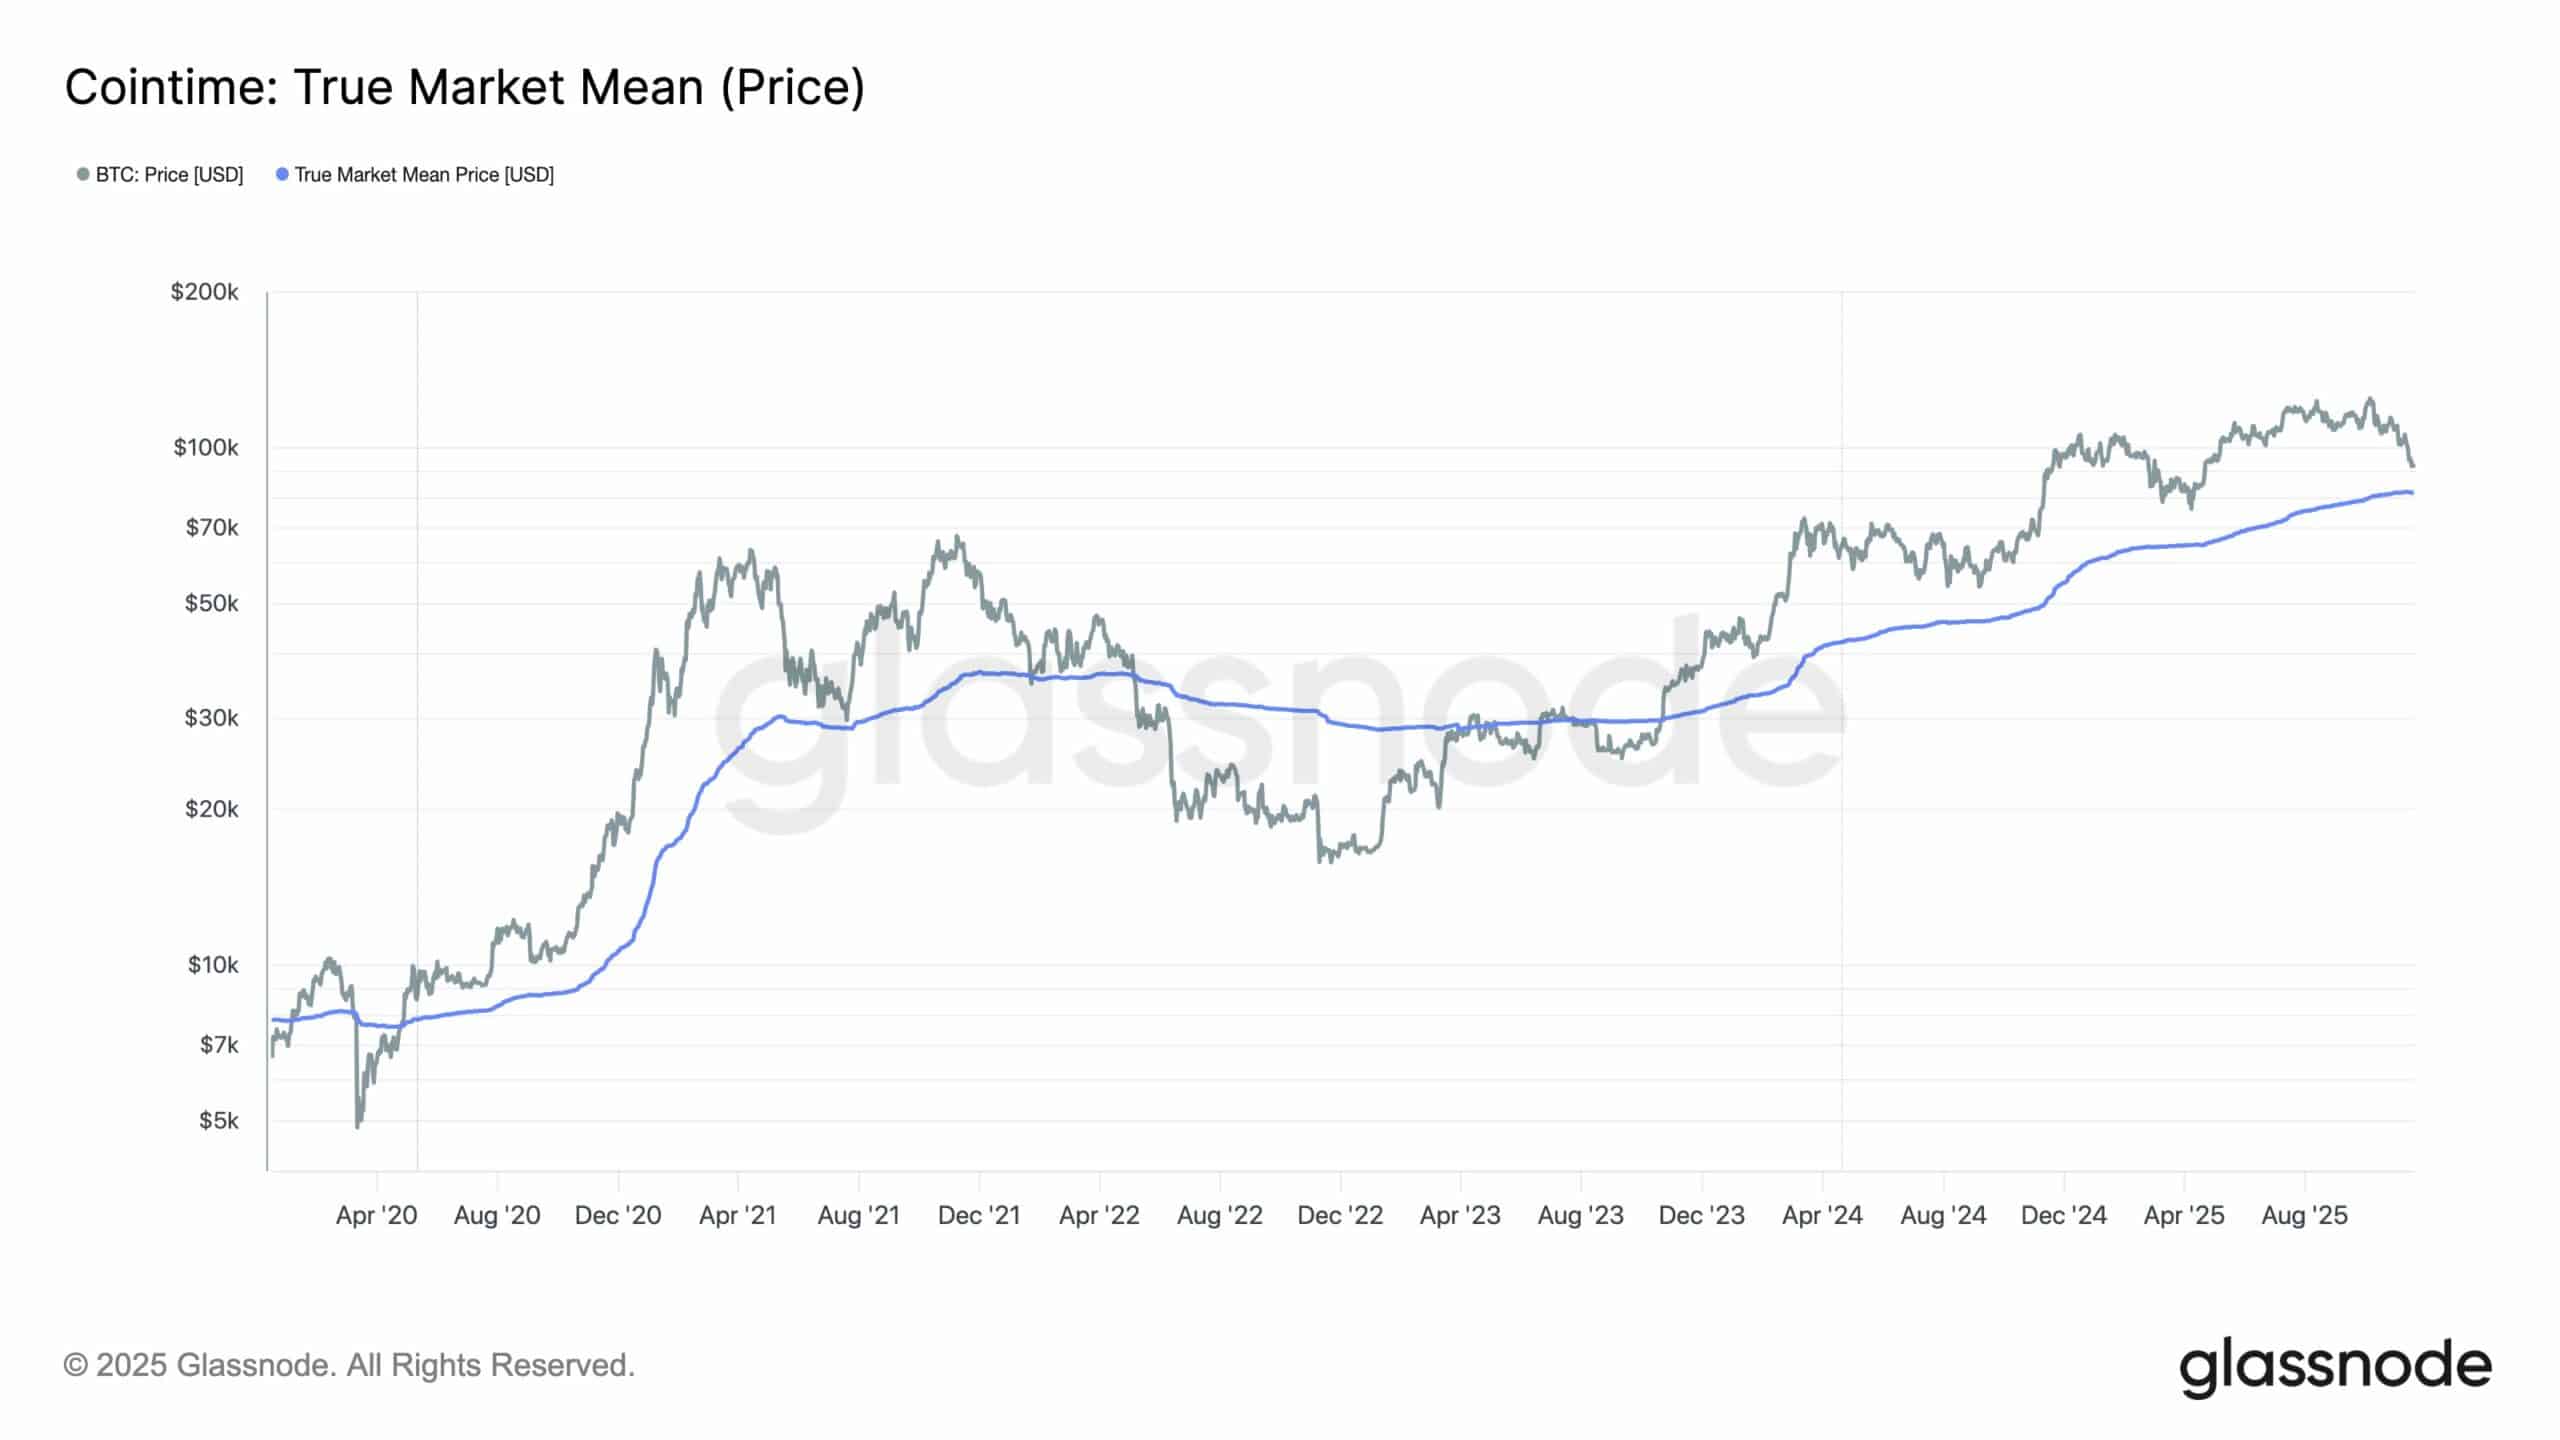
Source: Glassnode
Conclusion
In summary, Bitcoin’s bear market signals in 2025, including fractal patterns and negative Delta Growth Rate, point to a challenging period ahead with the price at $85,975. Yet, the True Market Mean at $81,900 provides a critical support level that could mitigate further losses and foster recovery. Investors should monitor these indicators closely for informed decisions in the evolving crypto landscape.
Comments
Other Articles
Bitcoin Price Analysis: Will the Uptrend Continue?
4/2/2026
Ethereum 2.0 Update: How Will It Affect the Crypto Market?
4/1/2026
The Coming of Altcoin Season: Which Coins Will Stand Out?
3/31/2026
DeFi Protocols and Yield Farming Strategies
3/30/2026