Bitcoin Dips to $82K Amid Volatility, Altcoins Surge as Traders Watch Support Levels
BTC/USDT
$5,893,102,060.79
$67,284.00 / $65,766.10
Change: $1,517.90 (2.31%)
-0.0007%
Shorts pay

Contents
Bitcoin’s price has dropped to $82,000 amid heightened market volatility, marking a 10% decline in the last 24 hours and testing critical support levels. This fall highlights shifting trader sentiment, with altcoins surging to capture 60% of trading volume on major exchanges, signaling opportunities beyond the dominant cryptocurrency.
-
Bitcoin tests $82K support: The cryptocurrency fell over 10% in 24 hours, raising concerns for traders as it approaches key max-pain zones between $73K and $84K.
-
Altcoins surge in activity: They now account for 60% of Binance trading volume, the highest since early 2025, as investors seek gains outside Bitcoin and Ethereum.
-
Major holders face mixed results: Bitcoin positions show $6.15 billion in unrealized gains, while Ethereum and Solana holdings reflect significant losses totaling over $5 billion.
Bitcoin price drop to $82K sparks volatility: Altcoins rise, traders watch supports. Discover key levels, holder impacts, and market shifts in this crypto update—stay informed on trends.
What Is Causing the Bitcoin Price Drop to $82K?
Bitcoin price drop to around $82,000 stems from broader market pressures, including a 10% decline over the past 24 hours and a 15% weekly loss, as reported by CoinMarketCap data. This marks the lowest level since April, with the global cryptocurrency market capitalization falling to $2.83 trillion, down 9.53%. Trading volume surged 39.19% to $249.68 billion, indicating heightened activity amid uncertainty, though long-term uptrends remain intact on weekly charts.
How Are Altcoins Performing Amid This Bitcoin Decline?
Altcoins are gaining significant traction during the Bitcoin price drop, with data from CryptoQuant analyst JA Maartun showing they represent 60% of Binance’s trading volume—the highest share since early 2025. Bitcoin and Ethereum together account for only 20% of activity, as traders pivot to smaller coins for potential quick returns. “This data reflects where actual trading activity is happening, and right now, it’s heavily concentrated outside the majors,” Maartun explained. Such shifts often signal speculative fervor, with historical patterns suggesting altcoin rallies during Bitcoin corrections, though risks of volatility persist. Supporting metrics from exchange data underscore this trend, positioning altcoins as a hedge against Bitcoin’s downturn while the overall market cap reflects broader caution.
When altcoin trading rises, it usually means people are speculating more. Traders might be chasing quick gains on smaller coins, showing caution toward Bitcoin even as its long-term trend stays strong.
Frequently Asked Questions
What Are the Key Support Levels for Bitcoin After the $82K Drop?
Key support levels for Bitcoin post-$82K include the $73,000 to $84,000 max-pain zones, as outlined by Bitwise Europe Research Head André Dragosch. These align with institutional cost bases, such as MicroStrategy’s average purchase at $73,000 and BlackRock’s IBIT near $84,000. A breach could trigger further selling, but historical data shows bounces from the 200-week EMA around $66,154.
Why Are Major Crypto Holders Experiencing Mixed Gains and Losses?
Major holders are seeing varied outcomes due to differing acquisition costs amid the Bitcoin price drop and altcoin volatility. For instance, MicroStrategy’s 649,870 BTC, bought at an average of $74,433, holds $6.15 billion in unrealized gains, representing a 12.72% profit. In contrast, Bitmine’s 3.56 million ETH at $4,010 average faces $4.52 billion in losses, a 31.67% decline, while Forward Industries’ 6.83 million SOL at $232 shows $711 million unrealized losses, illustrating uneven market impacts on portfolios.
Key Takeaways
- Bitcoin’s Sharp Correction: The drop to $82K tests short-term supports, with weekly losses exceeding 13%, but the asset remains above the 200-week EMA, preserving long-term bullish signals.
- Altcoin Momentum Builds: Surging to 60% of exchange volume, altcoins reflect trader diversification, potentially amplifying market recovery if Bitcoin stabilizes.
- Holder Resilience Varies: Institutions like MicroStrategy benefit from BTC gains, while ETH and SOL positions suffer; monitoring these could guide investment strategies in volatile times.
Bitcoin’s Technical Outlook and Holder Impacts
Bitcoin’s weekly chart, as analyzed on TradingView, maintains a long-term uptrend despite the ongoing correction. The 50-week EMA stands at $100,032, while the 200-week EMA is at $66,154, serving as indicators of momentum. The recent breach below the 50-week EMA highlights weakening short-term sentiment, yet proximity to the long-term channel’s lower boundary offers potential support.
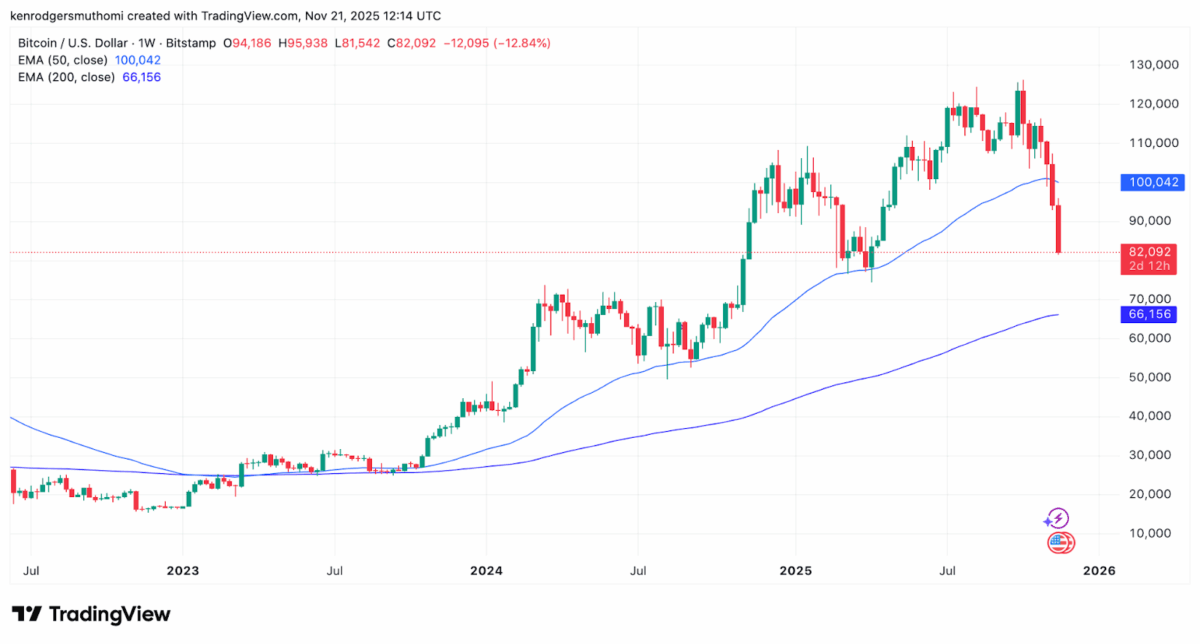
Bitcoin weekly chart, source: TradingView
Bitcoin opened the week at $94,186, dipped to $81,542, and stabilized near $82,000, resulting in over 13% weekly decline. Past resistance at $120,000 levels showed seller dominance, but staying above the 200-week EMA underscores enduring strength.
Blockchain analytics from Lookonchain reveal the uneven effects on large holders. MicroStrategy’s holdings demonstrate resilience with substantial profits, contrasting sharply with losses in Ethereum and Solana positions. These disparities emphasize the need for diversified strategies in cryptocurrency investments.
Forward Industries’ Solana holdings further illustrate this, with losses tied to acquisition prices amid the broader downturn. Bitwise’s Dragosch warns of potential “fire sale” scenarios at max-pain levels, urging traders to prepare for a possible cycle reset. Overall, these developments, drawn from reputable analytics firms like CoinMarketCap, CryptoQuant, and Lookonchain, demonstrate the crypto market’s interconnected dynamics.
Conclusion
The Bitcoin price drop to $82K, coupled with altcoin surges and mixed holder outcomes, underscores increasing volatility in the cryptocurrency landscape. As trading volumes climb and supports are tested, investors must navigate these shifts carefully, drawing on insights from experts like André Dragosch and JA Maartun. Looking ahead, stabilization around key EMAs could signal recovery opportunities—consider monitoring technical indicators and diversifying portfolios to capitalize on emerging trends in this dynamic market.

Comments
Other Articles
Bitwise Files for 11 Altcoin ETFs Including AAVE, UNI Amid SOL, XRP Muted Gains
December 31, 2025 at 08:47 PM UTC
Ethereum Whales Trim ETH Longs and Pivot to BTC in Dec 31 On-Chain Rebalance Update
December 31, 2025 at 01:27 PM UTC
Bitwise Files for 11 Crypto ETFs Including AAVE, NEAR, UNI Ahead of SEC Review
December 31, 2025 at 09:03 AM UTC