Bitcoin Fractal Hints at Deeper Correction to $40K Amid Countering Indicators
BTC/USDT
$34,057,419,982.02
$76,000.00 / $72,419.28
Change: $3,580.72 (4.94%)
+0.0041%
Longs pay

Contents
Bitcoin’s current correction has dropped from a $126,000 all-time high to around $87,000, a 32% decline. Fractal patterns from the Bitcoin Repeating Cycle indicator suggest a potential deeper fall to $40,000–$45,000 by October 2026, though off-chain metrics indicate it may be a minor pullback nearing its end.
-
Fractal analysis shows Bitcoin entered bearish phase after October 10 peak, projecting downside until 2026.
-
Current 32% retracement aligns with historical minor corrections under 35%.
-
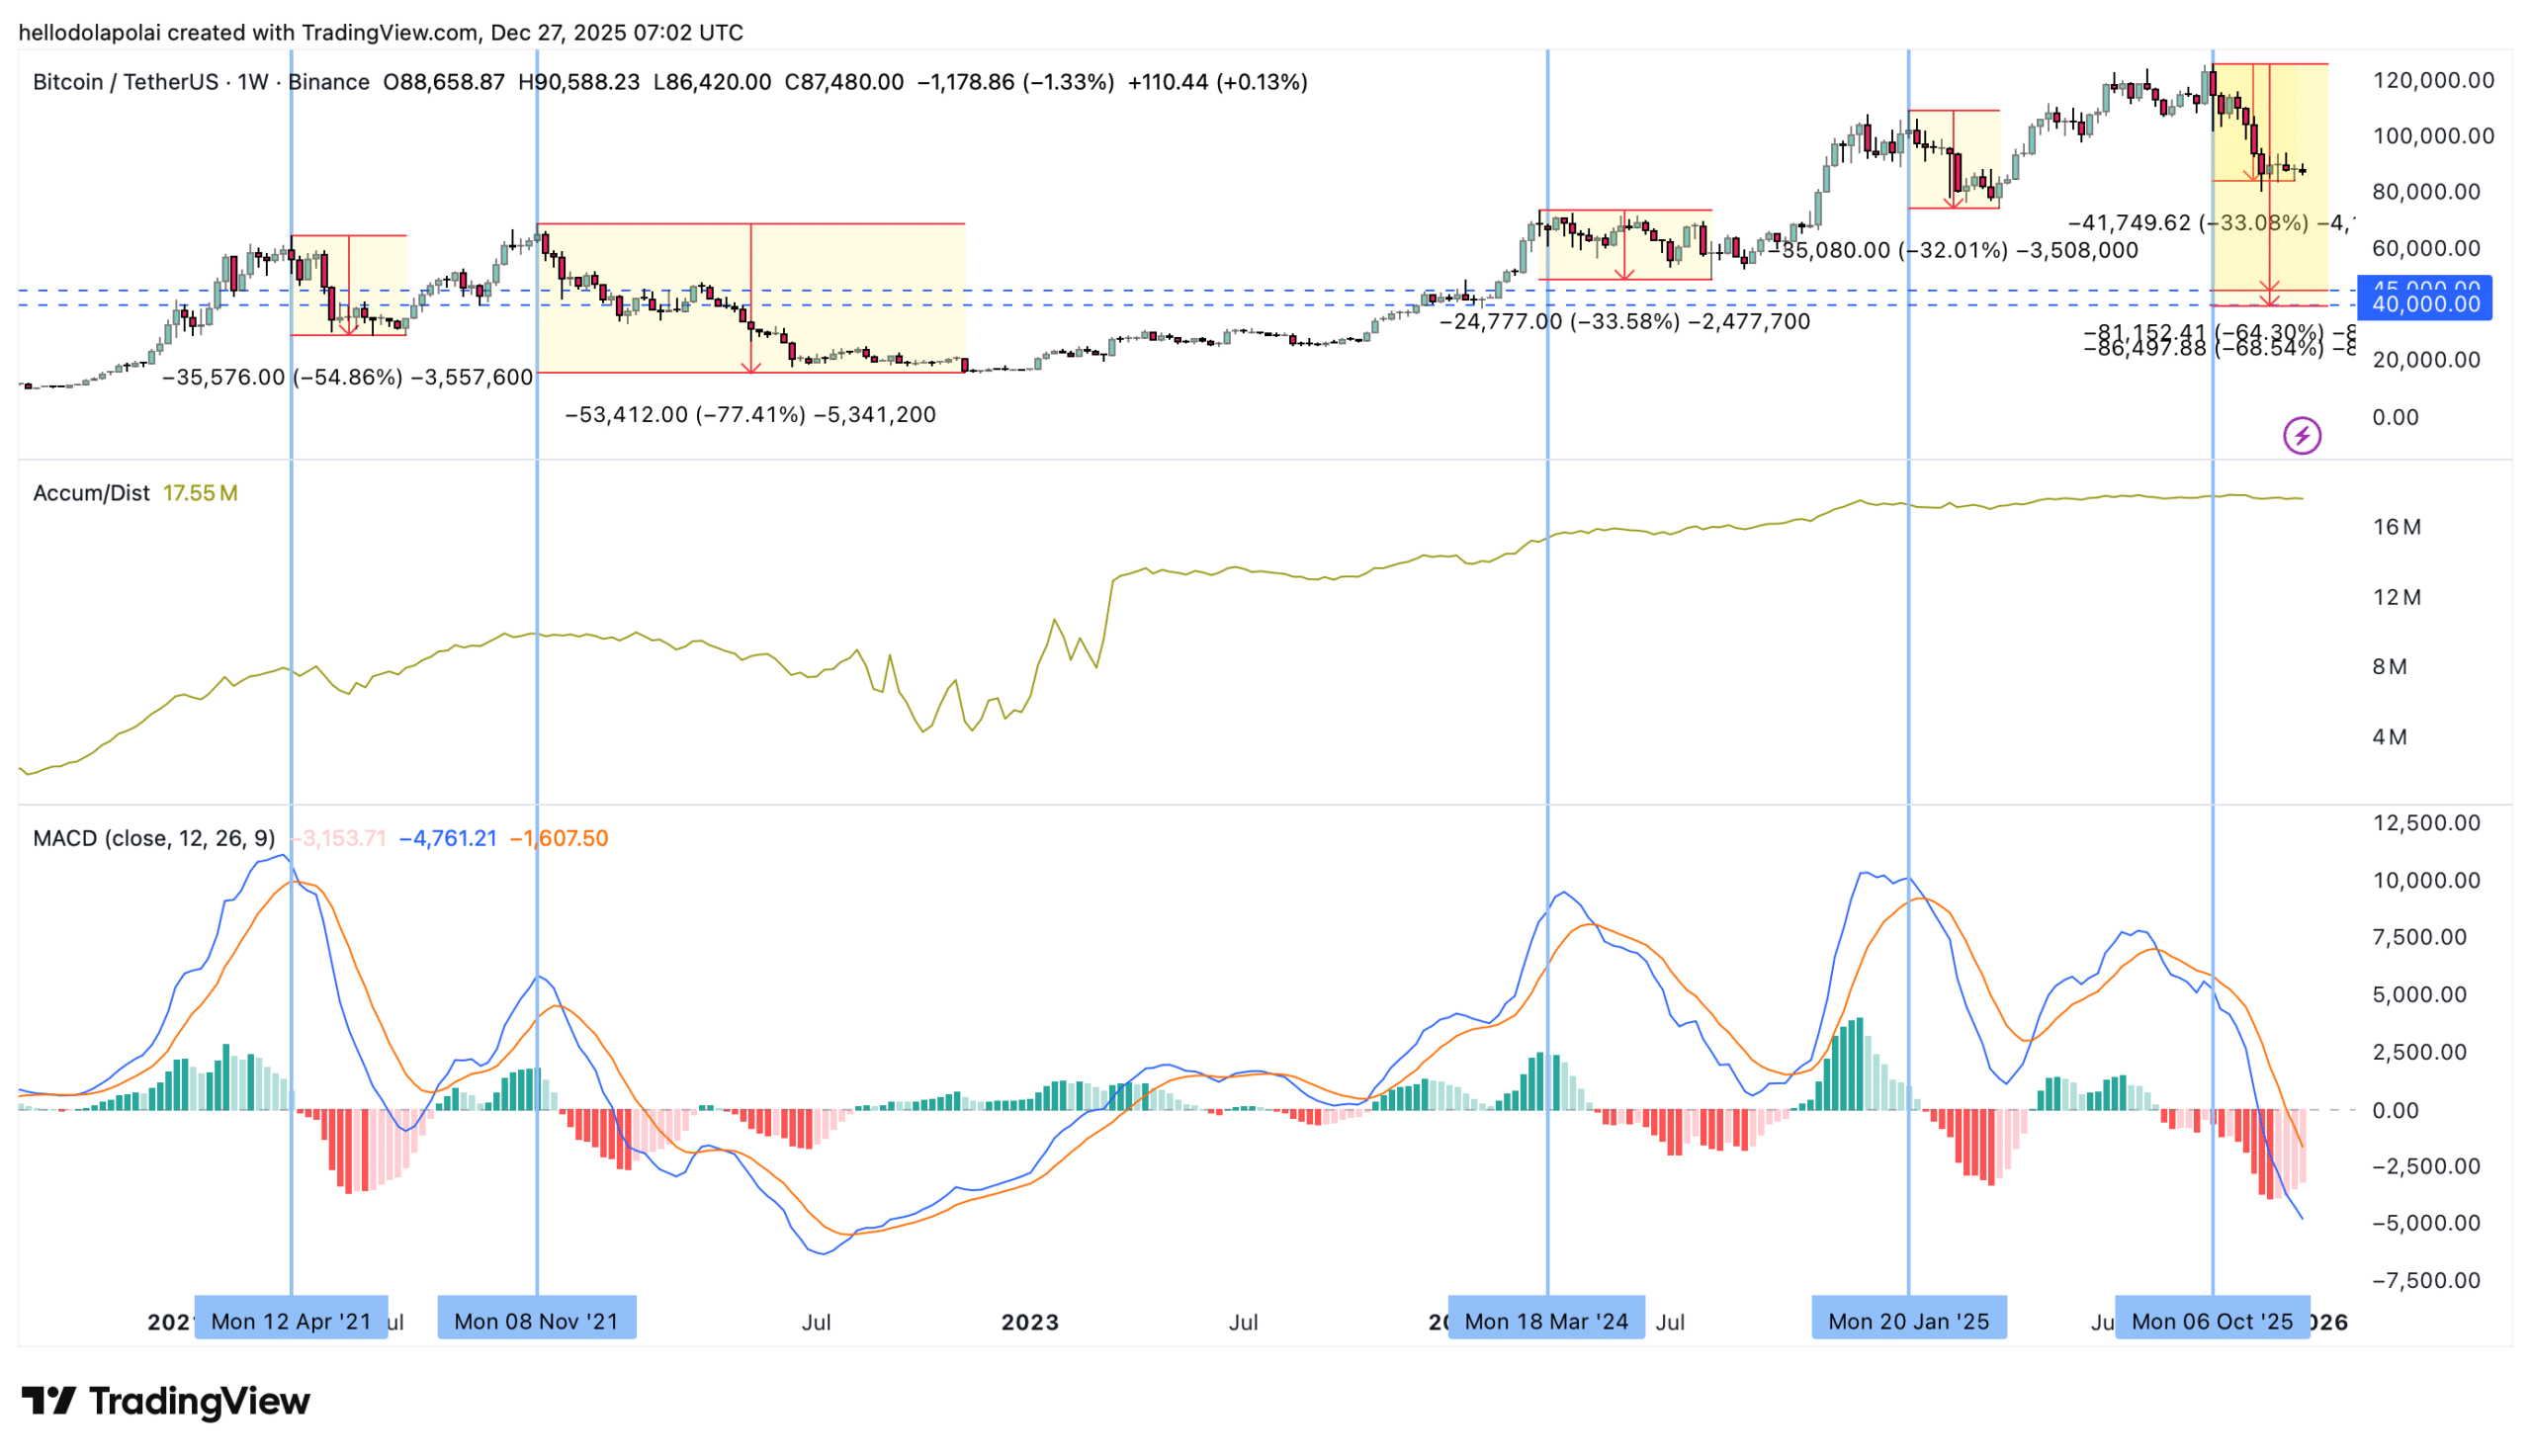
Accumulation/distribution volume stable at 17.5 million BTC, unlike 2021’s sharp drop signaling no major distribution.
Bitcoin correction from $126K ATH raises questions on depth. Fractals predict $40K bottom, but metrics suggest recovery. Stay informed on BTC trends and prepare your strategy today (152 characters).
What is the predicted depth of the Bitcoin correction?
Bitcoin correction from its recent all-time high of $126,000 has brought the price to approximately $87,000. The Bitcoin Repeating Cycle indicator, known for tracking bullish and bearish phases accurately, signals entry into a bearish territory following the October 10 peak. This could extend the decline until October 16, 2026, with a potential bottom between $40,000 and $45,000.
How does the Bitcoin fractal pattern forecast the bearish phase?
The fractal pattern, sourced from Alphractal, has historically aligned with Bitcoin’s cycle turns. It identified the recent market top and projects a prolonged bearish phase. Analyst João Wedson notes, “This is not a fixed rule, nor a deterministic price forecast. It represents a fractal rhyme of market cycles—something Bitcoin has historically respected more often than ignored.” A drop to $40,000–$45,000 would mark a 64–68% total decline, resembling major cycle corrections rather than minor ones. Data from TradingView charts supports the current 32% retracement comparison to past patterns.
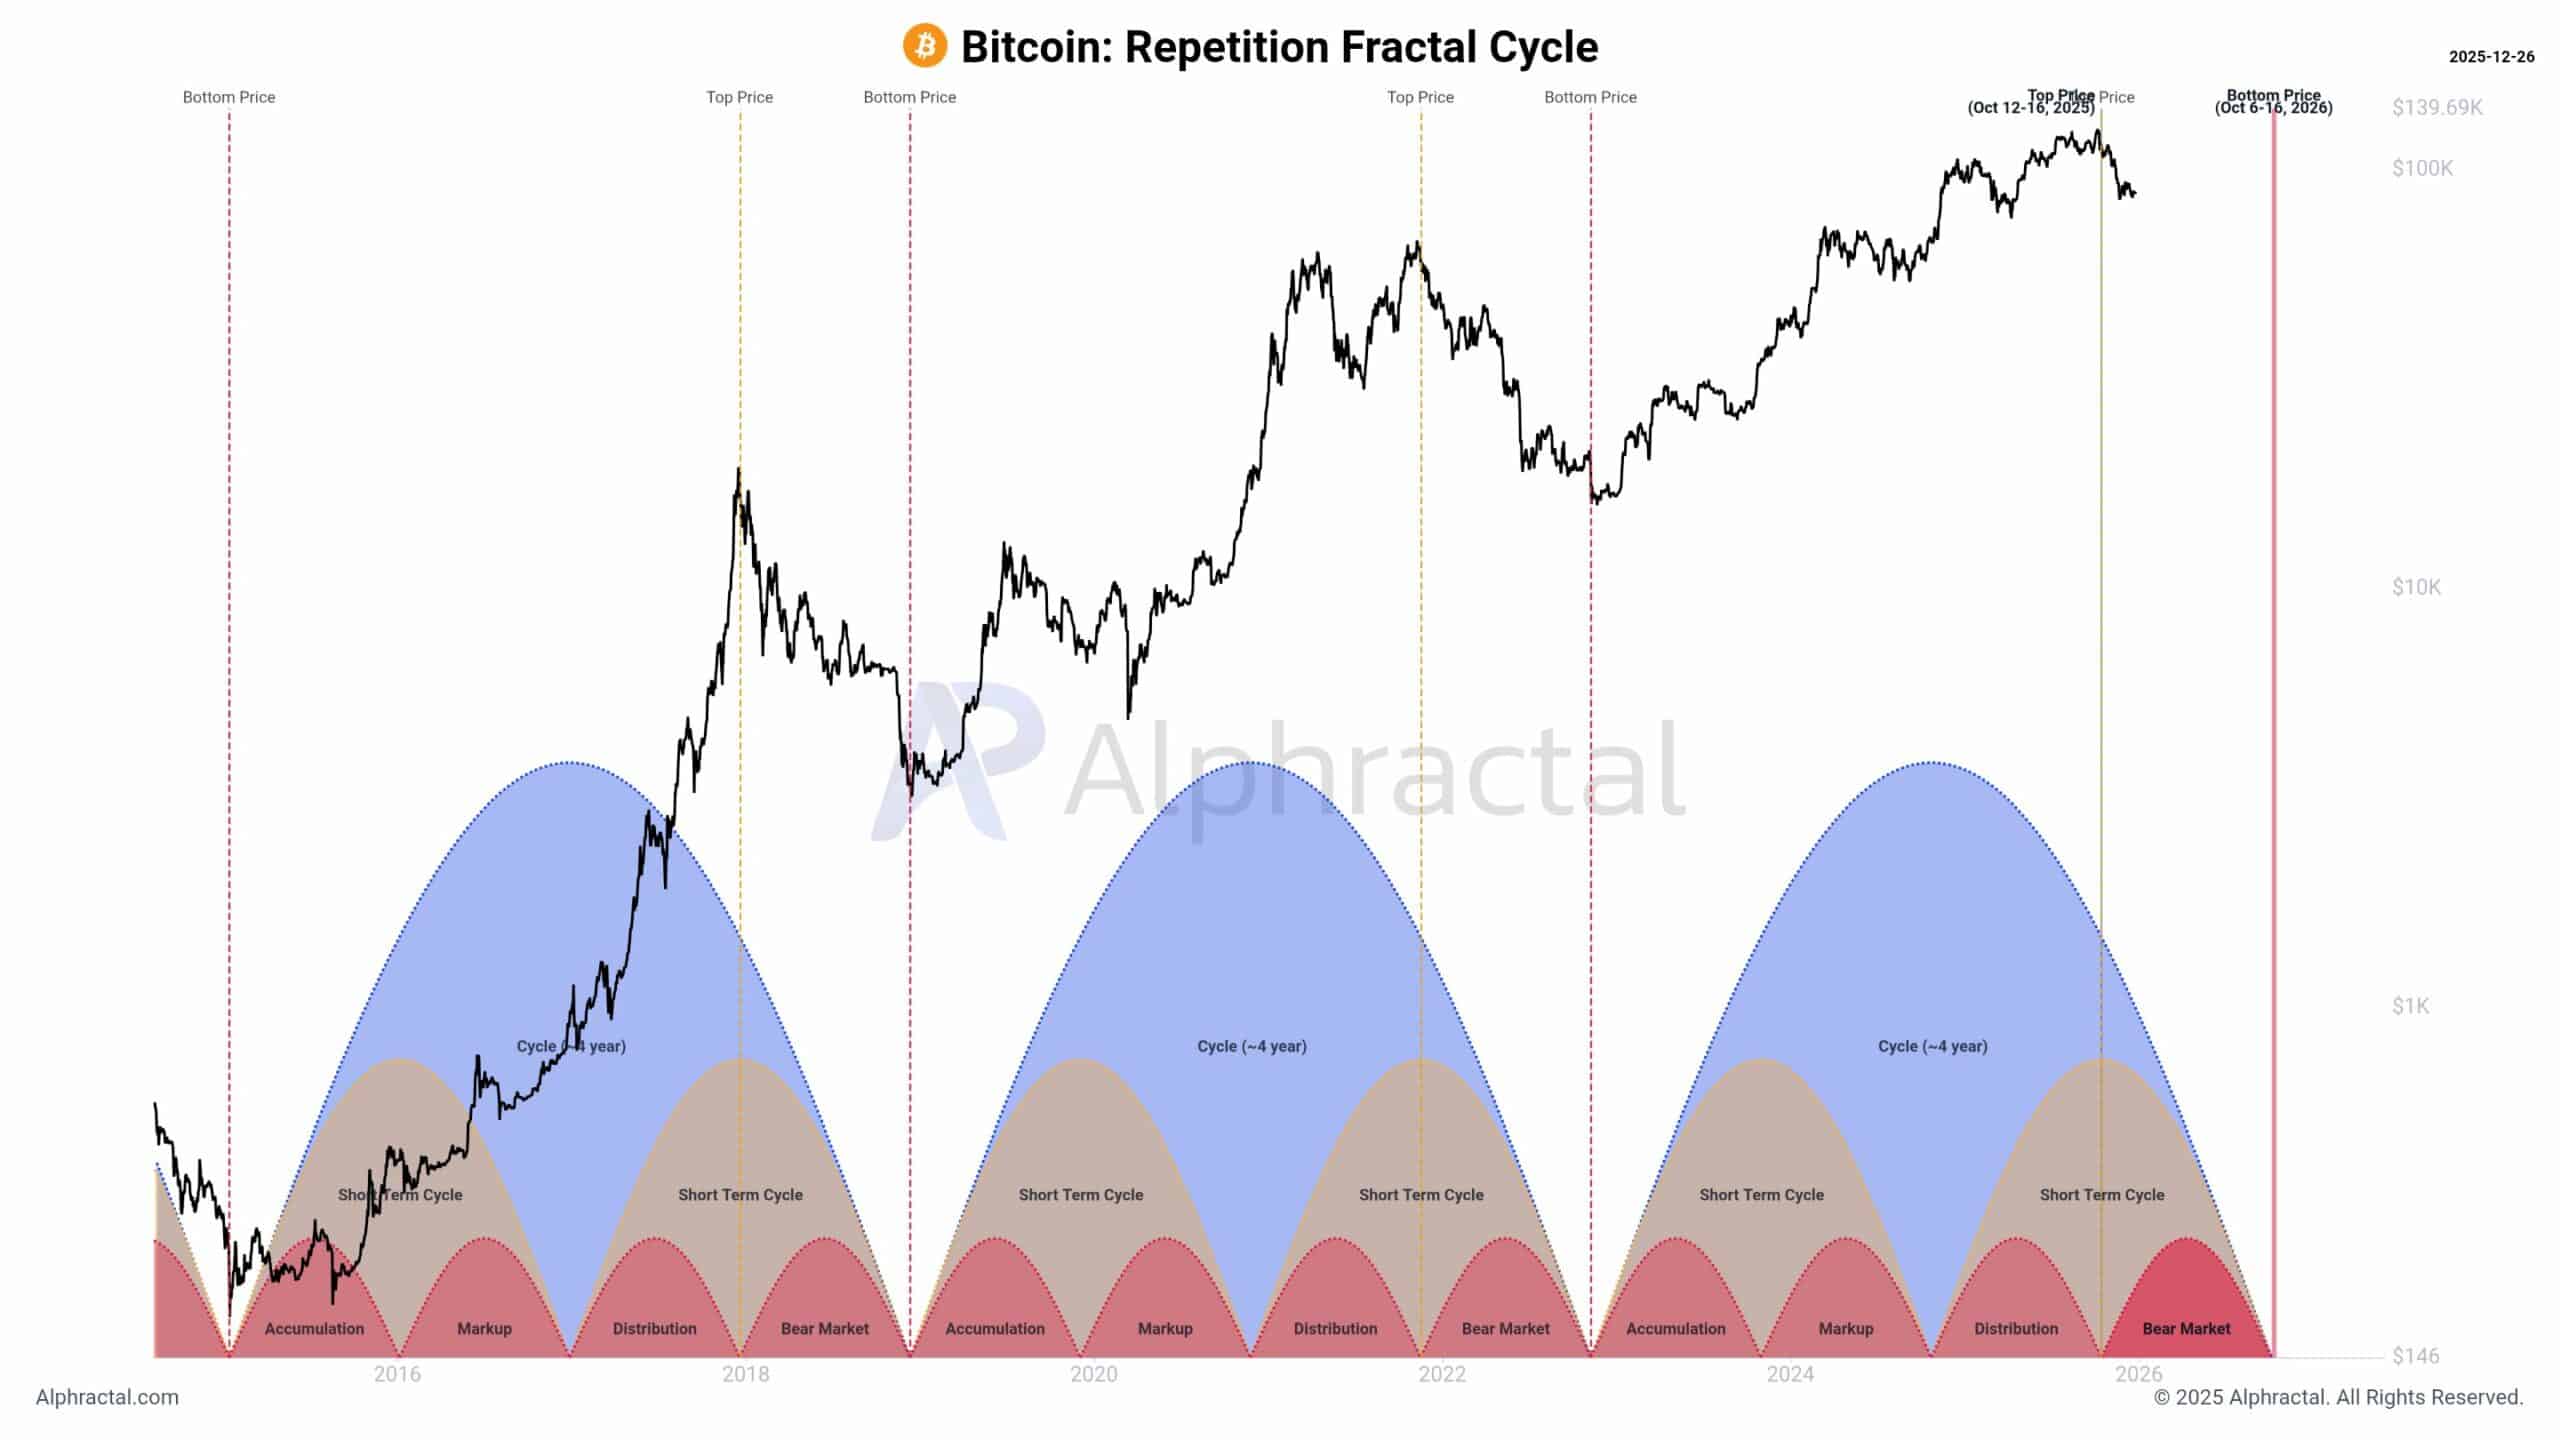
Source: Alphractal
Historical precedents show minor Bitcoin corrections typically cap at 35% declines, while the 2021 bear market reached 77% from $69,000. The ongoing Bitcoin correction mirrors 2021 patterns initially but stays within minor range so far.
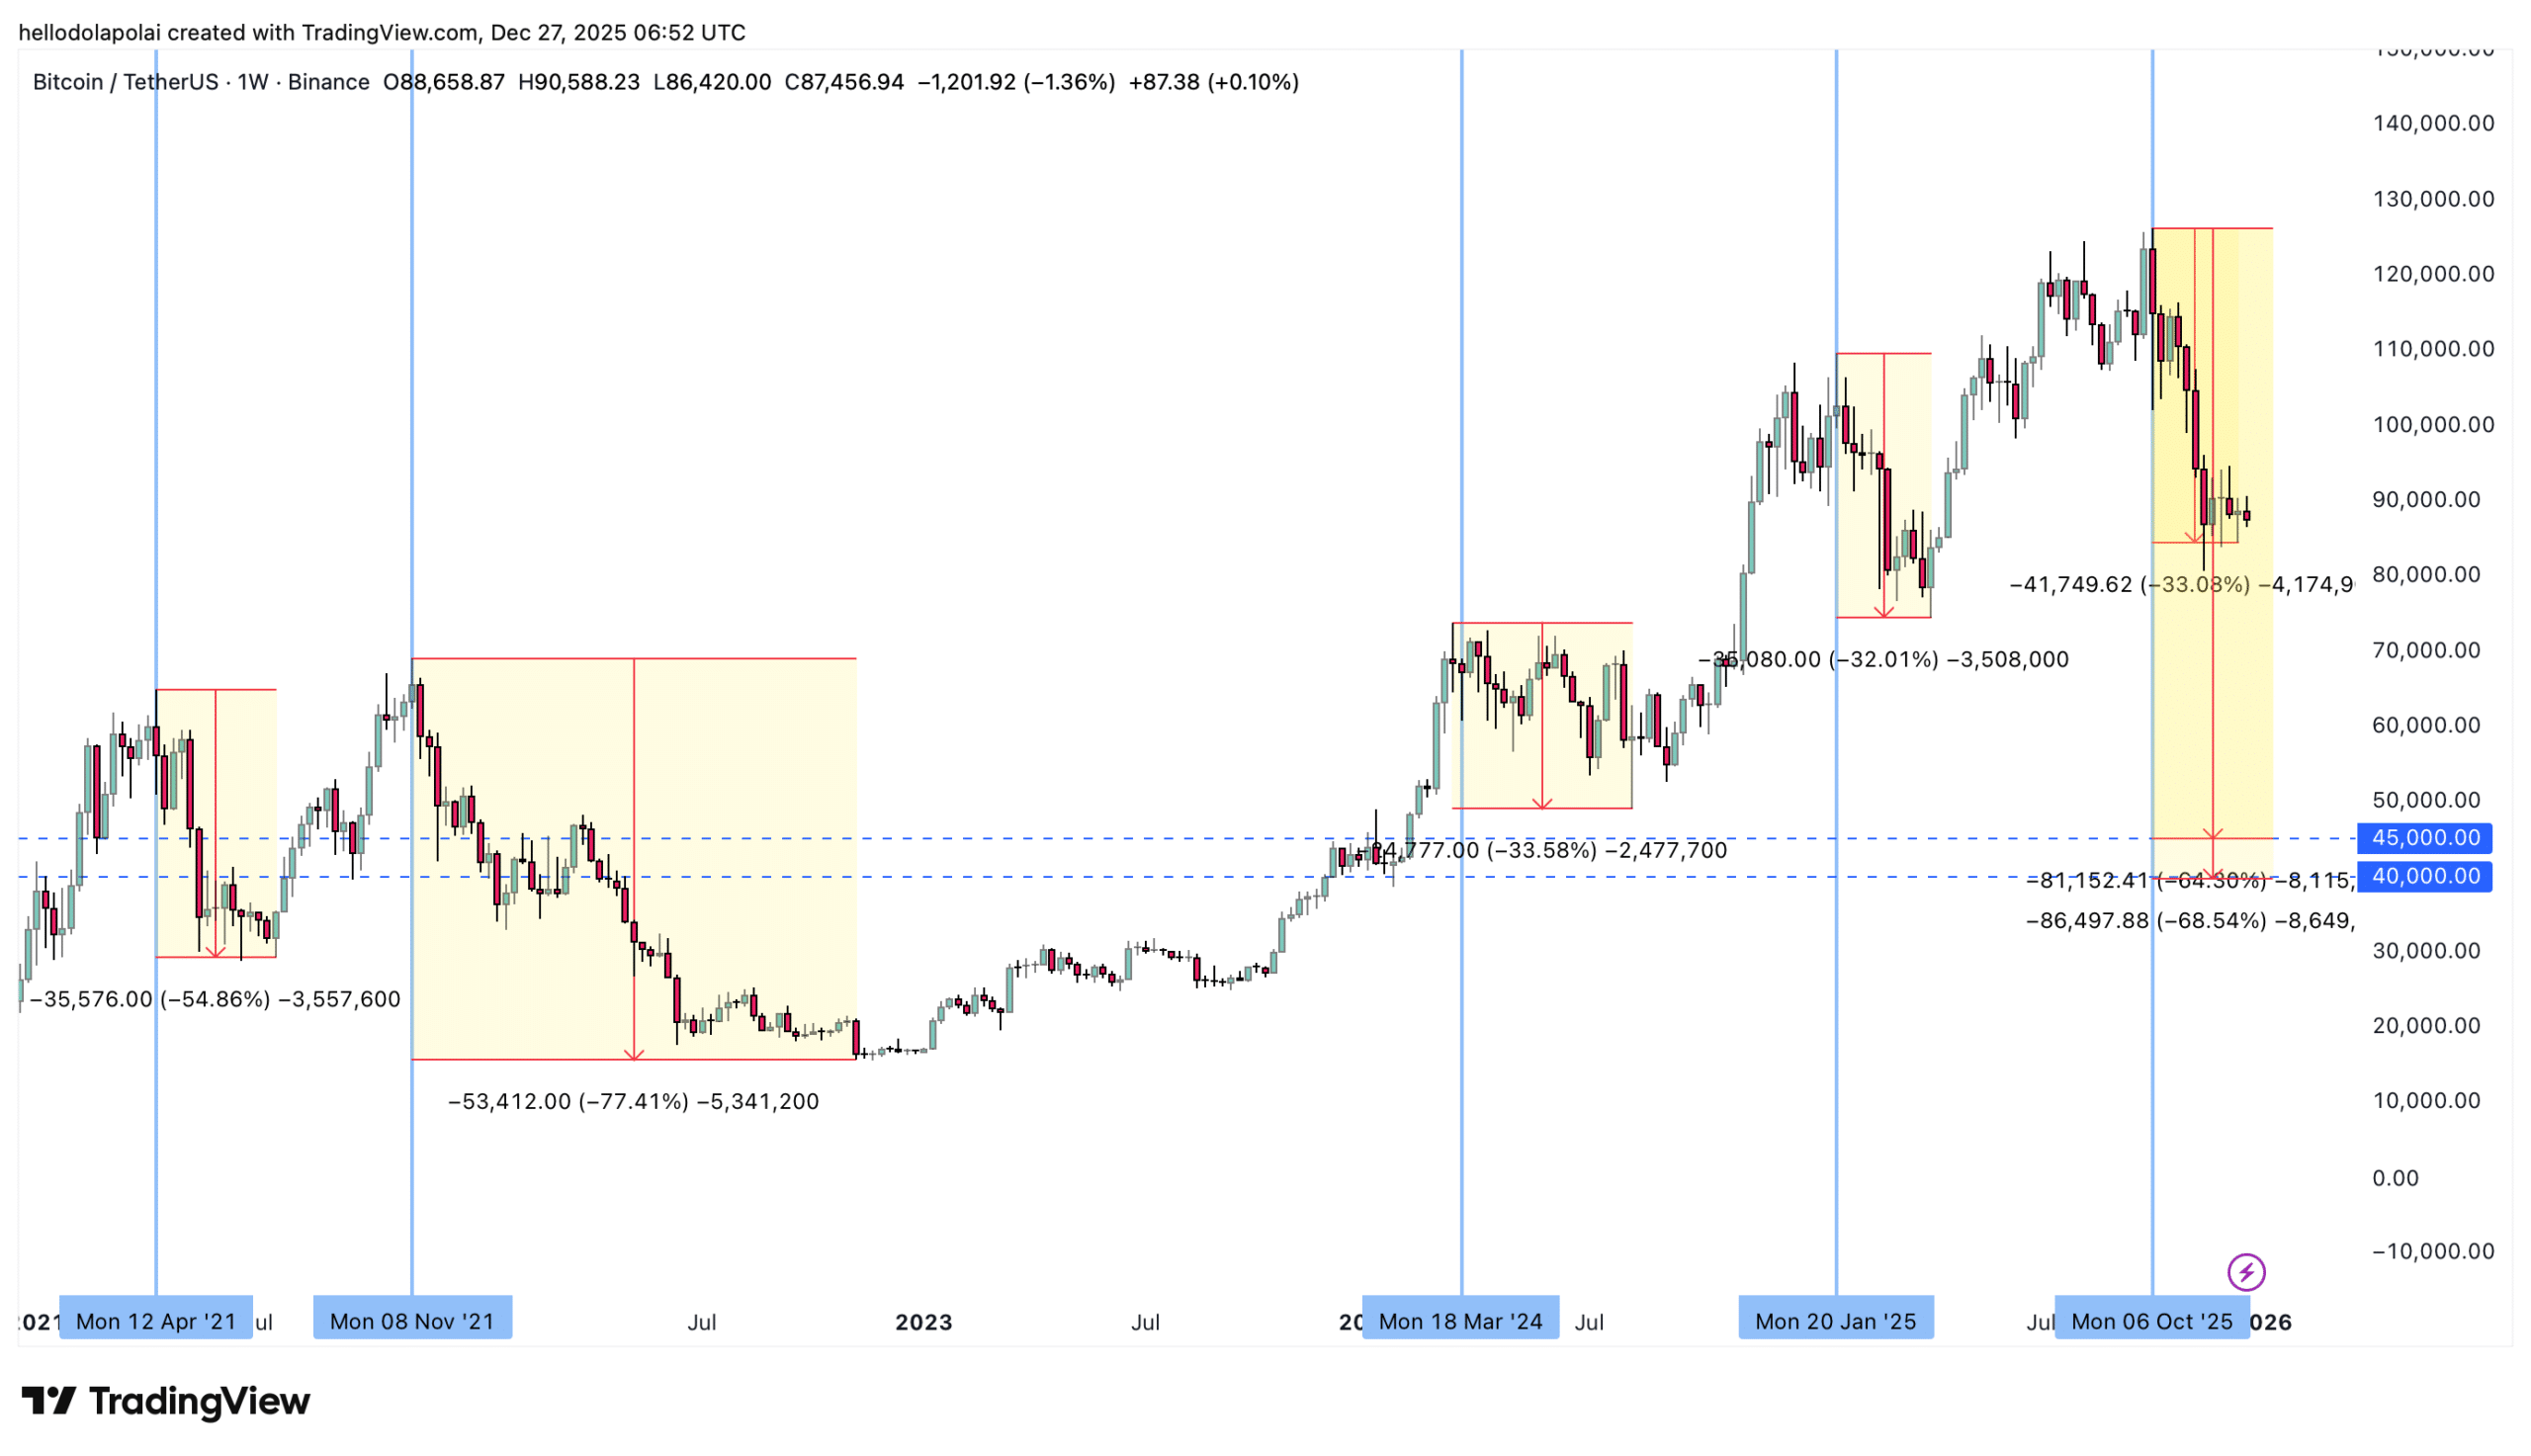
Source: TradingView
Frequently Asked Questions
Will Bitcoin correction reach $40,000 in the current cycle?
Fractal models from Alphractal project a possible bottom at $40,000–$45,000, extending bearish sentiment until October 2026. However, current metrics like stable A/D volume at 17.5 million BTC suggest limited downside compared to 2021’s 77% drop (48 words).
How long could the Bitcoin bearish fractal phase last?
According to the Bitcoin Repeating Cycle indicator, the bearish phase may persist until October 16, 2026, following the October 10 peak. This aligns with historical cycle rhymes but contrasts with on-chain stability showing no aggressive distribution (47 words).
Source: TradingView
MACD histogram lightening from deep red bars indicates potential bullish shift, differing from sustained bearish signals in prior major corrections. Off-chain accumulation/distribution line remains steady, dropping minimally from 17.63 million BTC to 17.52 million BTC.
Institutional factors bolster resilience. Spot Bitcoin ETFs in the U.S. and Hong Kong have attracted $116.58 billion. Global M2 money supply at $147 trillion supports risk assets amid liquidity growth.
Key Takeaways
- Fractal Projection: Bitcoin Repeating Cycle signals bearish phase to 2026, potential $40K–$45K bottom per Alphractal.
- Correction Context: 32% drop fits minor historical patterns under 35%, unlike 2021’s 77% decline.
- Institutional Support: ETF inflows and M2 expansion could drive recovery, challenging deep correction risks.
Conclusion
The Bitcoin correction from $126,000 tests investor resolve amid fractal bearish signals and stabilizing metrics. While the Bitcoin fractal pattern warns of extended downside, institutional demand via ETFs and steady volume point to a possible minor pullback conclusion. Monitor charts closely for cycle shifts and position accordingly in this evolving market.