Bitcoin’s Volatility Loop Raises Questions on Whale-Driven Deleverage
BTC/USDT
$5,893,102,060.79
$67,284.00 / $65,766.10
Change: $1,517.90 (2.31%)
-0.0007%
Shorts pay

Contents
Bitcoin price volatility is trapping the market in a cycle of sharp fluctuations, driven by thin liquidity and holder capitulation. Recent swings from $89,000 to $91,000 highlight risks of a flash crash, with net realized losses returning and ETF flows remaining subdued, pressuring the $90,000 level.
-
Bitcoin’s net realized profit/loss has turned negative, signaling holders selling at losses amid rising capitulation.
-
Choppy price action has led to over $500 million in liquidations in 24 hours, exacerbating market instability.
-
Open interest has dropped $30 billion from its peak, suggesting deliberate whale strategies to deleverage positions, with data from TradingView showing persistent volatility below the all-time high.
Explore Bitcoin price volatility causing market loops and potential flash crashes. Learn about net losses, liquidations, and whale influences shaping BTC’s future. Stay informed on crypto trends today.
What is driving the current Bitcoin price volatility?
Bitcoin price volatility stems primarily from uneven liquidity on the bid side and erratic holder behavior, creating a feedback loop of sharp price swings. In recent sessions, BTC has oscillated rapidly between $87,000 and $91,000, fueled by capitulation sales that flip net realized profit/loss metrics into negative territory. This dynamic, observed across major exchanges, underscores the asset’s sensitivity to short-term pressures despite trading 30% below its all-time high.
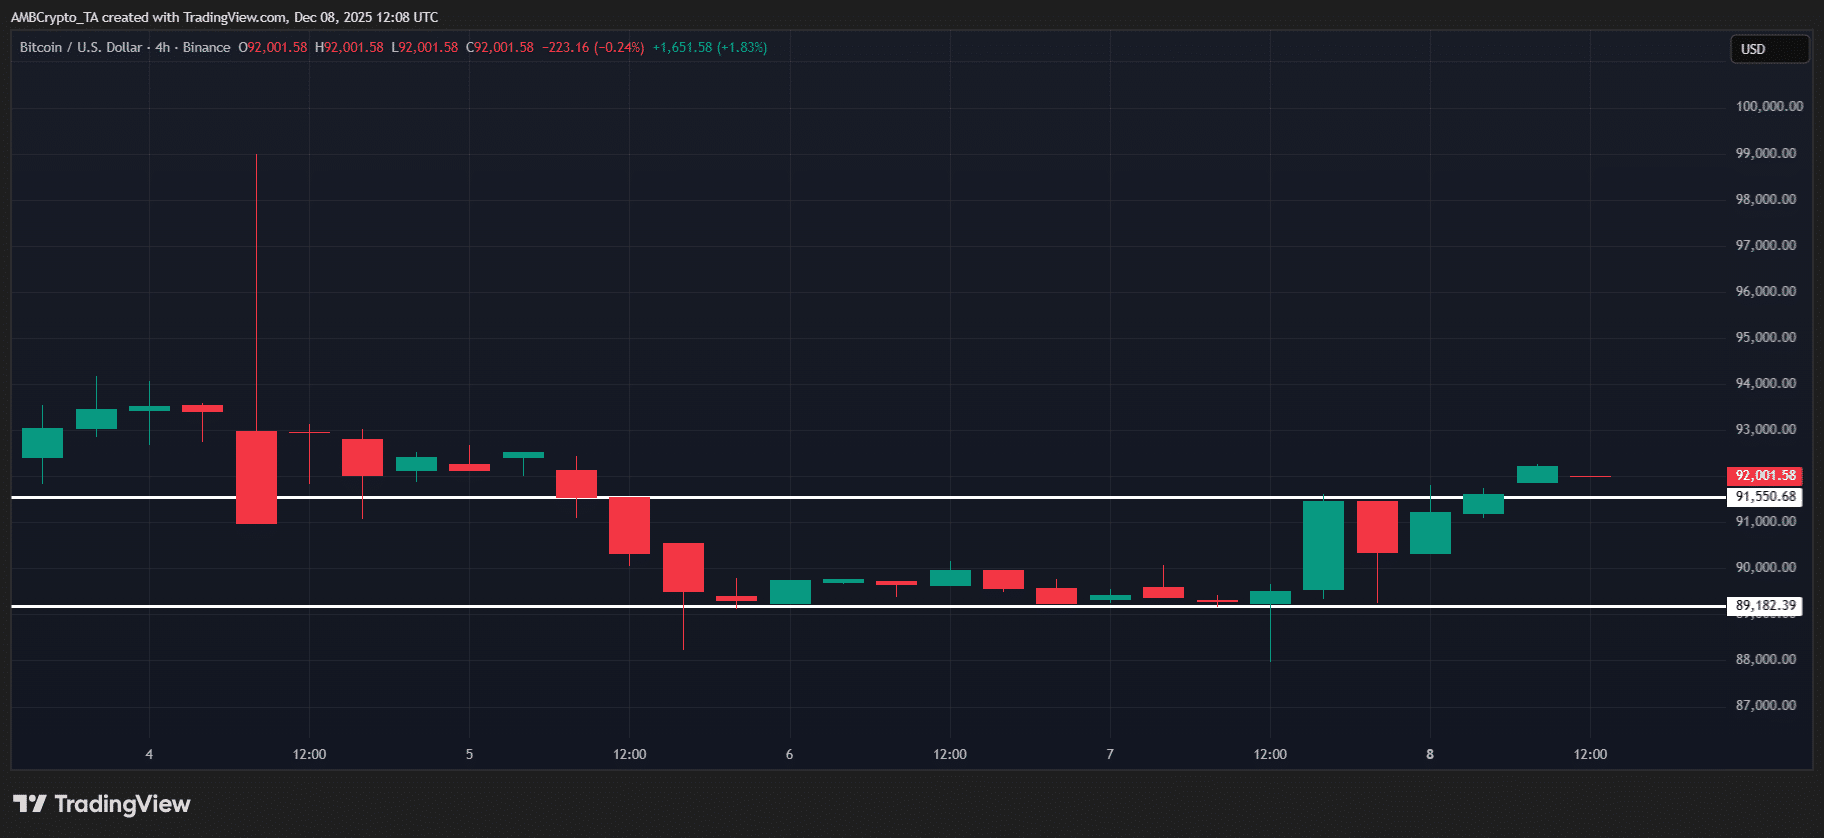
Source: TradingView (BTC/USDT)
How are liquidations contributing to Bitcoin’s volatility loop?
The surge in liquidations is intensifying Bitcoin price volatility by amplifying downward pressure during brief dips. Over the past 24 hours, approximately $500 million in positions have been wiped out, including $171 million in long trades and $71 million in shorts during a single four-hour period, according to data from Coinglass. This event underscores how leveraged trading exacerbates swings, as rapid price drops trigger cascading sales.
Market analysts, such as those tracking exchange flows, note that this pattern aligns with historical volatility episodes where high leverage meets low liquidity. For instance, Bitcoin’s open interest has declined by $30 billion from its October peak of $94 billion, indicating a deleveraging process that keeps prices trapped in a narrow range. ETF inflows, while showing a slight premium on Coinbase, remain lackluster, further signaling investor caution and contributing to the ongoing loop.
Experts from financial research firms emphasize that such liquidations often precede stabilization, but in the current environment, they highlight the risks of a flash crash if support levels below $87,000 falter. Short sentences like this aid readability: Volatility persists. Liquidations dominate. Recovery hinges on broader sentiment shifts.
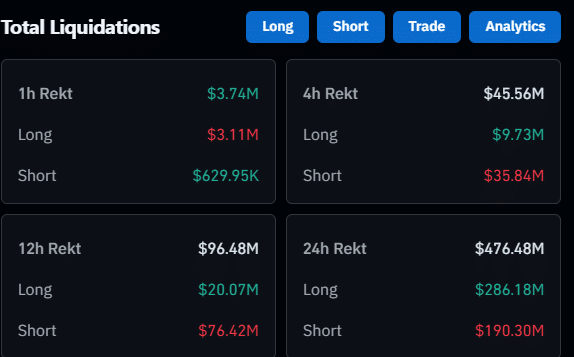
Source: Coinglass
Since the October downturn, Bitcoin has struggled to surpass $100,000, forming successive lower highs at $80,000, $83,000, and $88,000 on daily charts. This technical setup, combined with whale accumulation patterns reported by on-chain analytics platforms, suggests strategic positioning amid the chaos. Holders are offloading at losses, as evidenced by the negative net realized profit/loss, a metric calculated by Glassnode that compares realized profits to losses on exchanges.
The Coinbase Premium Index flashing green sporadically offers a glimmer of institutional interest, yet overall ETF flows indicate a risk-averse stance. Trading volumes have spiked during these volatile periods, but without sustained buying, the $90,000 threshold remains vulnerable. Regulatory discussions around leverage in crypto derivatives, as covered by Bloomberg, add another layer of uncertainty influencing trader behavior.
Frequently Asked Questions
What signs indicate a potential Bitcoin flash crash?
Indicators of a potential Bitcoin flash crash include persistent net realized losses, as holders sell below cost basis, and thin bid liquidity amplifying small sell orders into large drops. Recent data shows BTC dipping from $89,000 to $87,000 before rebounding, with over $500 million in 24-hour liquidations signaling heightened risk. Monitoring exchange netflows and open interest drops provides early warnings for such events.
Why is Bitcoin’s open interest declining amid volatility?
Bitcoin’s open interest is declining because traders are reducing leveraged exposure to avoid liquidation risks in this choppy market. From a peak of $94 billion in October, it has fallen by $30 billion, as positions unwind during price swings. This natural response helps stabilize the market over time by lowering overall leverage, making voice searches for Bitcoin trends more relevant for understanding long-term health.
Key Takeaways
- Net Realized Losses Resurface: Bitcoin holders are capitulating by selling at a loss, flipping the net realized profit/loss metric negative and increasing downward pressure on prices.
- Liquidations Fuel the Cycle: Over $500 million in 24-hour liquidations, particularly in longs, are trapping BTC in volatility loops and questioning whale manipulation tactics.
- Deleveraging as a Path Forward: Declining open interest suggests smart money is clearing excess leverage, potentially setting the stage for a more stable recovery above $90,000.
Conclusion
In summary, Bitcoin price volatility continues to dominate the crypto landscape through capitulation-driven net losses and massive liquidations, creating a deleveraging loop that challenges the $90,000 support. As ETF flows stabilize and whale activities align with on-chain data from sources like Glassnode, the market shows resilience below its all-time high. Investors should monitor these metrics closely, positioning for potential rebounds as regulatory clarity emerges in 2025.