BNB Approaches $840 Support Amid Mixed Signals and Potential Stabilization
BNB/USDT
$169,974,454.24
$619.00 / $608.70
Change: $10.30 (1.69%)
+0.0006%
Longs pay

Contents
BNB is trading near the crucial $840 support level after repeated failures to reclaim resistance at the golden pocket, with contracting downside volume signaling reduced selling pressure and potential stabilization in the short term. The 200-day SMA serves as a key trend indicator amid mixed signals across timeframes.
-
BNB approaches $840 support zone as declining volume eases downward momentum during recent consolidation.
-
Daily charts reveal stalled recovery near resistance, with the 200-day simple moving average acting as a pivotal boundary.
-
Intraday action shows resilient buying, holding above breakout levels with 24-hour gains supported by shorter-term moving averages.
Explore BNB price analysis: Trading near $840 support with contracting volume and mixed signals. Discover key levels and intraday strength for informed trading decisions in 2025.
What is the Current Status of BNB Price Near Support?
BNB price analysis indicates the asset is navigating a critical juncture, trading near the $840 support zone after multiple resistance rejections. Contracting downside volume suggests limited aggressive selling, allowing for potential stabilization, while the 200-day simple moving average remains a decisive long-term trend marker. Intraday charts reflect improving buyer engagement, holding recent gains above key breakout levels.
How Does Volume Contraction Influence BNB’s Short-Term Direction?
Volume contraction plays a significant role in shaping BNB’s near-term outlook by reducing the intensity of downward pressure. As price drifts lower, shrinking downside volume highlights a lack of strong seller conviction, which often precedes stabilization at support levels. According to market analyst Umair Crypto, this pattern indicates tentative bulls rather than outright weakness, with price slipping without expanded selling. Historical data from similar setups shows that such environments can lead to effective support holds, as seen in past volatility phases where BNB attracted buyers repeatedly at $840. This controlled pressure fosters a balanced market tone, potentially setting the stage for recovery toward $890-$905 if the zone remains intact. Expert insights from platforms like CoinMarketCap reinforce that volume trends are crucial for assessing momentum sustainability in cryptocurrency markets.
BNB trades near crucial support after repeated resistance failures, with contracting volume and mixed time-frame signals shaping short-term direction.
- BNB trades near the $840 support zone as contracting downside volume reduces pressure during the recent pullback phase.
- Market signals show stalled momentum near the golden pocket, with the 200-day SMA acting as a decisive trend marker.
- Intraday charts indicate sustained buying interest as BNB holds recent gains above breakout levels during short-term recovery.
BNB enters a crucial phase as the market reevaluates trend strength across multiple timeframes. The asset trades within a mixed structure where daily resistance remains intact while intraday action shows improving momentum and steadier buyer engagement.
Daily Structure Shows Pressure Near Long-Term Levels
BNB’s recent interaction with the golden pocket remains central to the current outlook. The asset attempted another reclaim on the daily chart but failed, leaving price below a resistance cluster that has capped several recovery attempts. Umair Crypto noted that this repeated rejection maintains a heavier tone, with the broader trend still lacking sustained upward commitment.
$BNB ⚠️📉
BNB tried to reclaim the golden pocket on the daily but failed again, and now it’s flirting with losing the 200-day SMA after briefly regaining it, a sign that bulls are still tentative.
The positive is that volume is not expanding to the downside; price is slipping… pic.twitter.com/nb7eMF86Ql— Umair Crypto (@Umairorkz) December 11, 2025
Another key feature on the daily timeframe is BNB’s position relative to the 200-day SMA. After briefly moving above the line, follow-through buying did not materialize, and price has slipped back underneath. This behavior suggests uncertainty rather than clear weakness, as the market continues to test long-term structural boundaries without decisive movement.
Volume Contraction and Support Interaction Shape Near-Term Tone
While price action has softened, the volume pattern offers a different signal. Umair Crypto pointed out that downside volume is shrinking while price drifts lower, signaling limited aggressive selling. This environment often allows support levels to stabilize more effectively when market pressure remains controlled.
BNB’s support cluster near $840 remains a critical reference level. The zone has held through several volatility phases and continues to attract buyers on repeated dips. Recent reactions show consistent interest at lower boundaries, and as long as this region holds, the setup favors movement toward mid-range levels near $890 to $905.
Intraday Momentum Reflects Strength Despite Wider Trend Caution
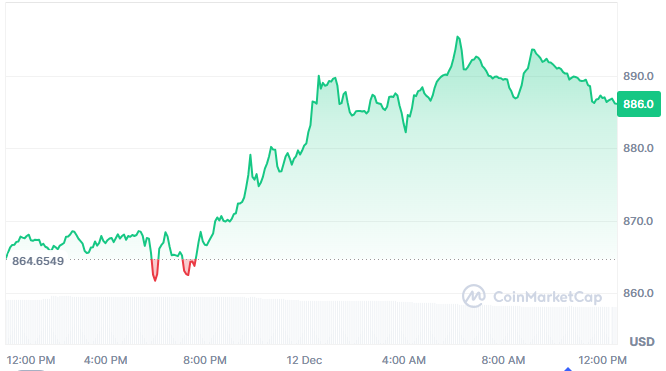
The 24-hour intraday chart reveals stronger structural behavior than the daily chart suggests. BNB recovered from an early consolidation phase between $864 and $866, later breaking upward into a sustained move that carried price above earlier intraday resistance. The most recent level near $886.9 places it comfortably above its breakout origin.
Additionally, the 4-hour update from Web3趋势棠棠 shows BNB reclaiming shorter-term moving averages such as MA7 and approaching MA25. Although the broader structure remains range-bound, the pattern reflects an ongoing repair phase as price works within the 859 to 906 range. Together, these signals show continued contention between buyers and sellers across multiple timeframes.
Frequently Asked Questions
What is the significance of the $840 support level for BNB in 2025?
The $840 support level for BNB acts as a foundational boundary, having absorbed multiple dips and attracted consistent buying interest. Holding this zone prevents deeper corrections and supports potential rebounds to $890-$905, as evidenced by historical price reactions during volatile periods.
How can traders interpret BNB’s volume contraction in current market conditions?
Traders can view BNB’s volume contraction as a sign of easing selling pressure, where lower downside volume during price slips indicates balanced market sentiment. This often leads to stabilization at support, making it a favorable setup for monitoring short-term recovery signals without aggressive downside risks.
Key Takeaways
- Support at $840 is pivotal: This level has repeatedly drawn buyers, reducing the likelihood of immediate breakdowns if volume remains controlled.
- 200-day SMA as trend marker: Brief crosses above and below highlight ongoing uncertainty, but failure to hold below could signal renewed bullish momentum.
- Intraday strength advises caution: Monitor for sustained breaks above $886.9 to confirm broader trend shifts and capitalize on recovery opportunities.
Conclusion
In this BNB price analysis, the asset’s position near $840 support underscores a delicate balance influenced by contracting volume and mixed timeframe signals. With the 200-day SMA and golden pocket resistance defining key boundaries, sustained buyer interest on intraday charts suggests potential for stabilization. As market dynamics evolve in 2025, traders should watch these levels closely for opportunities, staying informed through reliable data sources to navigate volatility effectively.