BTC ETF Outflows and StanChart Forecast Revision
BTC/USDT
$14,125,837,161.52
$64,394.44 / $62,829.81
Change: $1,564.63 (2.49%)
+0.0002%
Longs pay

US spot Bitcoin (BTC) ETFs experienced selling pressure with a $410.4 million outflow on Thursday, bringing weekly losses to $375.1 million. This development coincided with Standard Chartered lowering its 2026 BTC price forecast from $150,000 to $100,000. The bank's report predicts that BTC could drop to $50,000 and Ether (ETH) to $1,400 in the coming months, but rise to $100,000 for BTC and $4,000 for ETH by year-end. ETF assets under management approached $80 billion, down from the October 2025 peak of $170 billion.
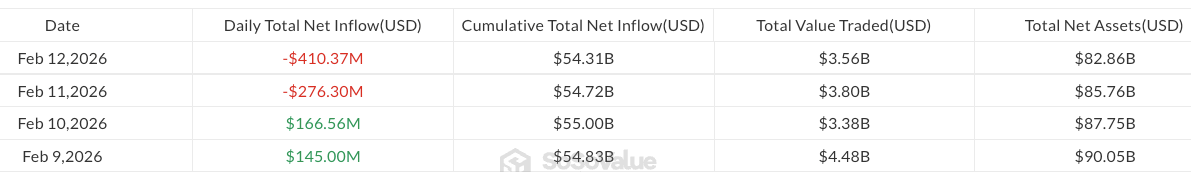
Daily flows in US spot Bitcoin ETFs since Monday. Source: SoSoValue
Detailed Outflow Analysis in US Spot BTC ETFs
All 11 BTC ETFs trended negative; BlackRock iShares Bitcoin Trust (IBIT) saw $157.6 million, Fidelity Wise Origin $104.1 million outflow. These sales indicate deteriorating market sentiment. BTC price is currently at 66,709.86 $ level, trading down -0.83% in the last 24 hours.
What Do Standard Chartered's BTC and ETH Price Forecasts Mean?
StanChart's revision reflects macroeconomic uncertainties and ETF sales. In the short term, BTC could drop to $50,000, but the year-end $100,000 target remains a bullish signal. For ETH, a rise to $4,000 is expected after a $1,400 bottom. These forecasts are analyzed in depth on our BTC detailed analysis pages.
Latest Status on ETH, XRP, and SOL ETF Flows
ETH ETFs reached $171.4 million weekly with a $113.1 million outflow. XRP ETFs experienced their first $6.4 million outflow, while Solana (SOL) ETFs recorded $2.7 million inflow. These mixed flows signal altcoin rotation.
| ETF Type | Daily Outflow/Inflow (Million $) | Weekly Total |
|---|---|---|
| BTC | -410.4 | -375.1 |
| ETH | -113.1 | -171.4 |
| XRP | -6.4 | -6.4 |
| SOL | +2.7 | +2.7 |
CryptoQuant Realized Price Support and BTC Bottom Levels
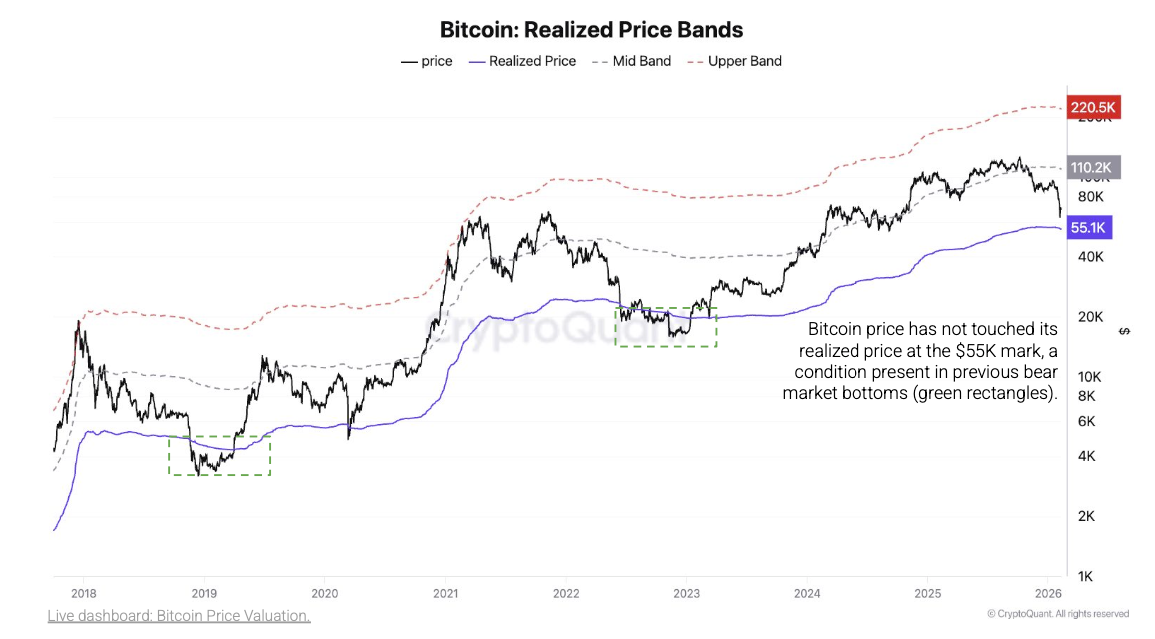
BTC's realized price chart. Source: CryptoQuant
CryptoQuant stated that BTC's realized price support is around $55,000 and that the extreme bear market has not yet started. RSI at 30.34 is in oversold territory; downtrend continues, Supertrend bearish. Strong supports:
- S1: 65,463.95 $ (Score: 77/100 ⭐ Strong)
- S2: 60,000 $ (Score: 72/100 ⭐ Strong)
Resistances: R1 67,036 $ (+0.54%), R2 70,165 $ (+5.23%). For detailed chart, BTC futures.
Institutional Purchases Boost BTC Support
Despite outflows, there are positive developments: Goldman Sachs accumulated $1.1 billion BTC, $1 billion ETH, $153 million XRP, and $108 million SOL. Binance SAFU fund bought 4,545 BTC worth $304.58 million. Interactive Brokers launched Coinbase nano BTC and ETH futures 24/7. These moves support long-term accumulation. Click for ETH detailed analysis.
Critical Levels and Outlook for BTC Investors
BTC, which has fallen to $65,250, could test the $55,000 support. RSI oversold indicates high rebound potential. ETF AUM near $80 billion, far from October 2025 peak. Institutional inflows could balance selling pressure.
Add COINOTAG as a Preferred Source
Add COINOTAG to your preferred sources in Google News and Search to see our coverage first.
Add on GoogleRelated Tags
AI-generated, AI-reviewed, under COINOTAG editorial oversight.