BTC Spot ETFs Recovering: 371M$ Net Inflow
BTC/USDT
$13,993,515,591.40
$64,394.44 / $62,829.81
Change: $1,564.63 (2.49%)
+0.0002%
Longs pay

US spot Bitcoin (BTC) ETFs showed signs of recovery by attracting $371 million in net inflows on Friday, while taking in another $145 million on Monday when BTC was around $70,000. According to SoSoValue and CoinGecko data, these inflows have not yet offset last week's $318 million outflow and approximately $1.9 billion in redemptions since the beginning of the year, but the slowing of losses may signal a potential trend reversal.
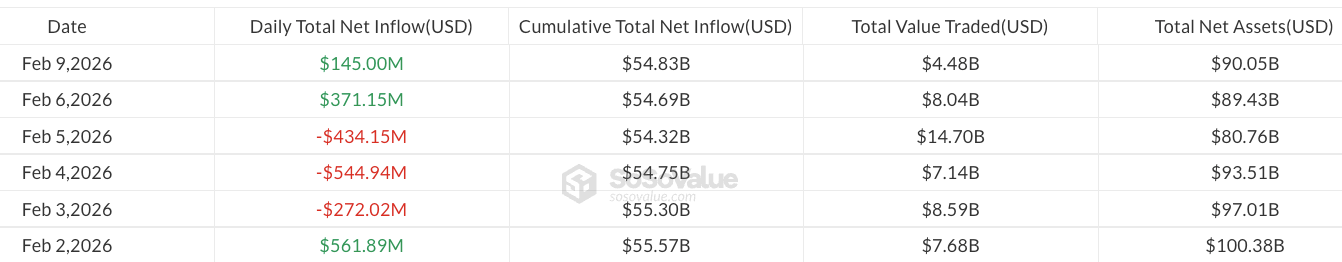
Current Figures in BTC Spot ETF Flows
CoinShares Research Director James Butterfill noted that outflows fell to $187 million despite price pressure, signaling a historical turning point. According to February 9, 2026 data, Bitcoin ETFs saw $144.9 million in net inflows. This carries potential to reverse the weak flows of the last week. The table below summarizes the recent flows:
| Date | BTC ETF Net Inflow ($M) | Note |
|---|---|---|
| Friday | 371 | Recovery start |
| Monday | 145 | BTC ~70K |
| February 9 | 144.9 | SoSoValue |
Institutional Investors' BTC Stances
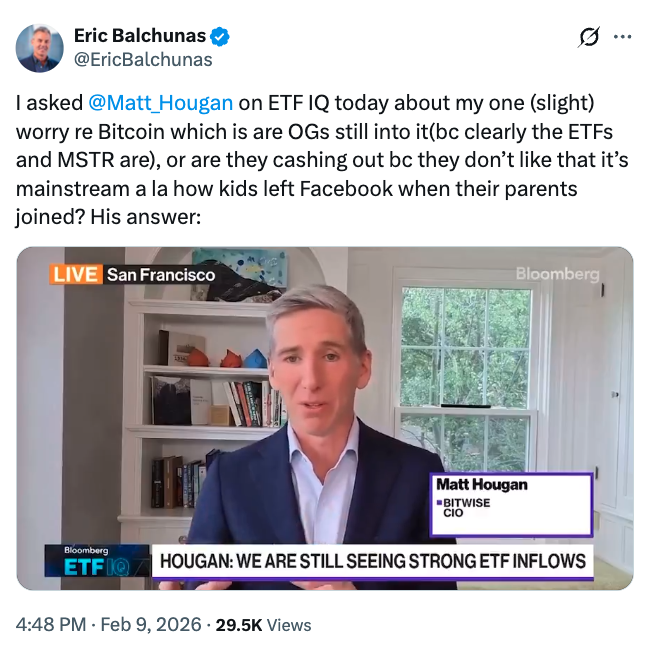
According to Bitwise Chief Investment Officer Matt Hougan, despite institutional inflows, early Bitcoin investors have not exited the market; most are still holding positions while realizing short-term profits. Bernstein analysts described the recent drop as the weakest bear scenario in Bitcoin history. Binance SAFU Fund's purchase of another 4225 BTC ($299.6 million), bringing its total assets to 10455 BTC ($734 million), strengthens institutional accumulation. Click for detailed BTC analysis.
Inflows in ETH and XRP ETFs
On the same day, spot altcoin ETFs saw $57 million in Ether (ETH) inflows and $6.3 million in XRP. Ethereum ETFs also moved in parallel with $57 million net inflows. This is a positive signal for an altcoin rally.
BTC Technical Analysis: Support and RSI Signals
Current BTC price is $68,814 (-1.99% 24h). RSI at 31.90 is in the oversold region, although the downtrend continues with Supertrend bearish. EMA 20: $77,305. Strong supports:
- S1: $62,909 (81/100 ⭐ strong, -8.58% distance)
- S2: $68,231 (66/100 ⭐ strong, -0.85%)
Resistances: R1 $71,911 (+4.50%). Check BTC futures.
| Level | Price ($) | Score | Distance |
|---|---|---|---|
| S1 | 62.909 | 81/100 | -8.58% |
| R1 | 71.911 | 73/100 | +4.50% |
Trend Reversal Potential and Risks
The slowing of outflows and institutional purchases could support recovery above 70K. However, YTD $1.9B redemptions should be monitored. With RSI oversold, a short-term rebound is possible, but bearish Supertrend requires attention. ETH spot analysis also shows similar signals.
Add COINOTAG as a Preferred Source
Add COINOTAG to your preferred sources in Google News and Search to see our coverage first.
Add on GoogleRelated Tags
AI-generated, AI-reviewed, under COINOTAG editorial oversight.