

BTC Spot Volumes Decline to 2024 Lows
BTC/USDT
$18,857,575,523.82
$65,799.00 / $63,100.00
Change: $2,699.00 (4.28%)
+0.0043%
Longs pay

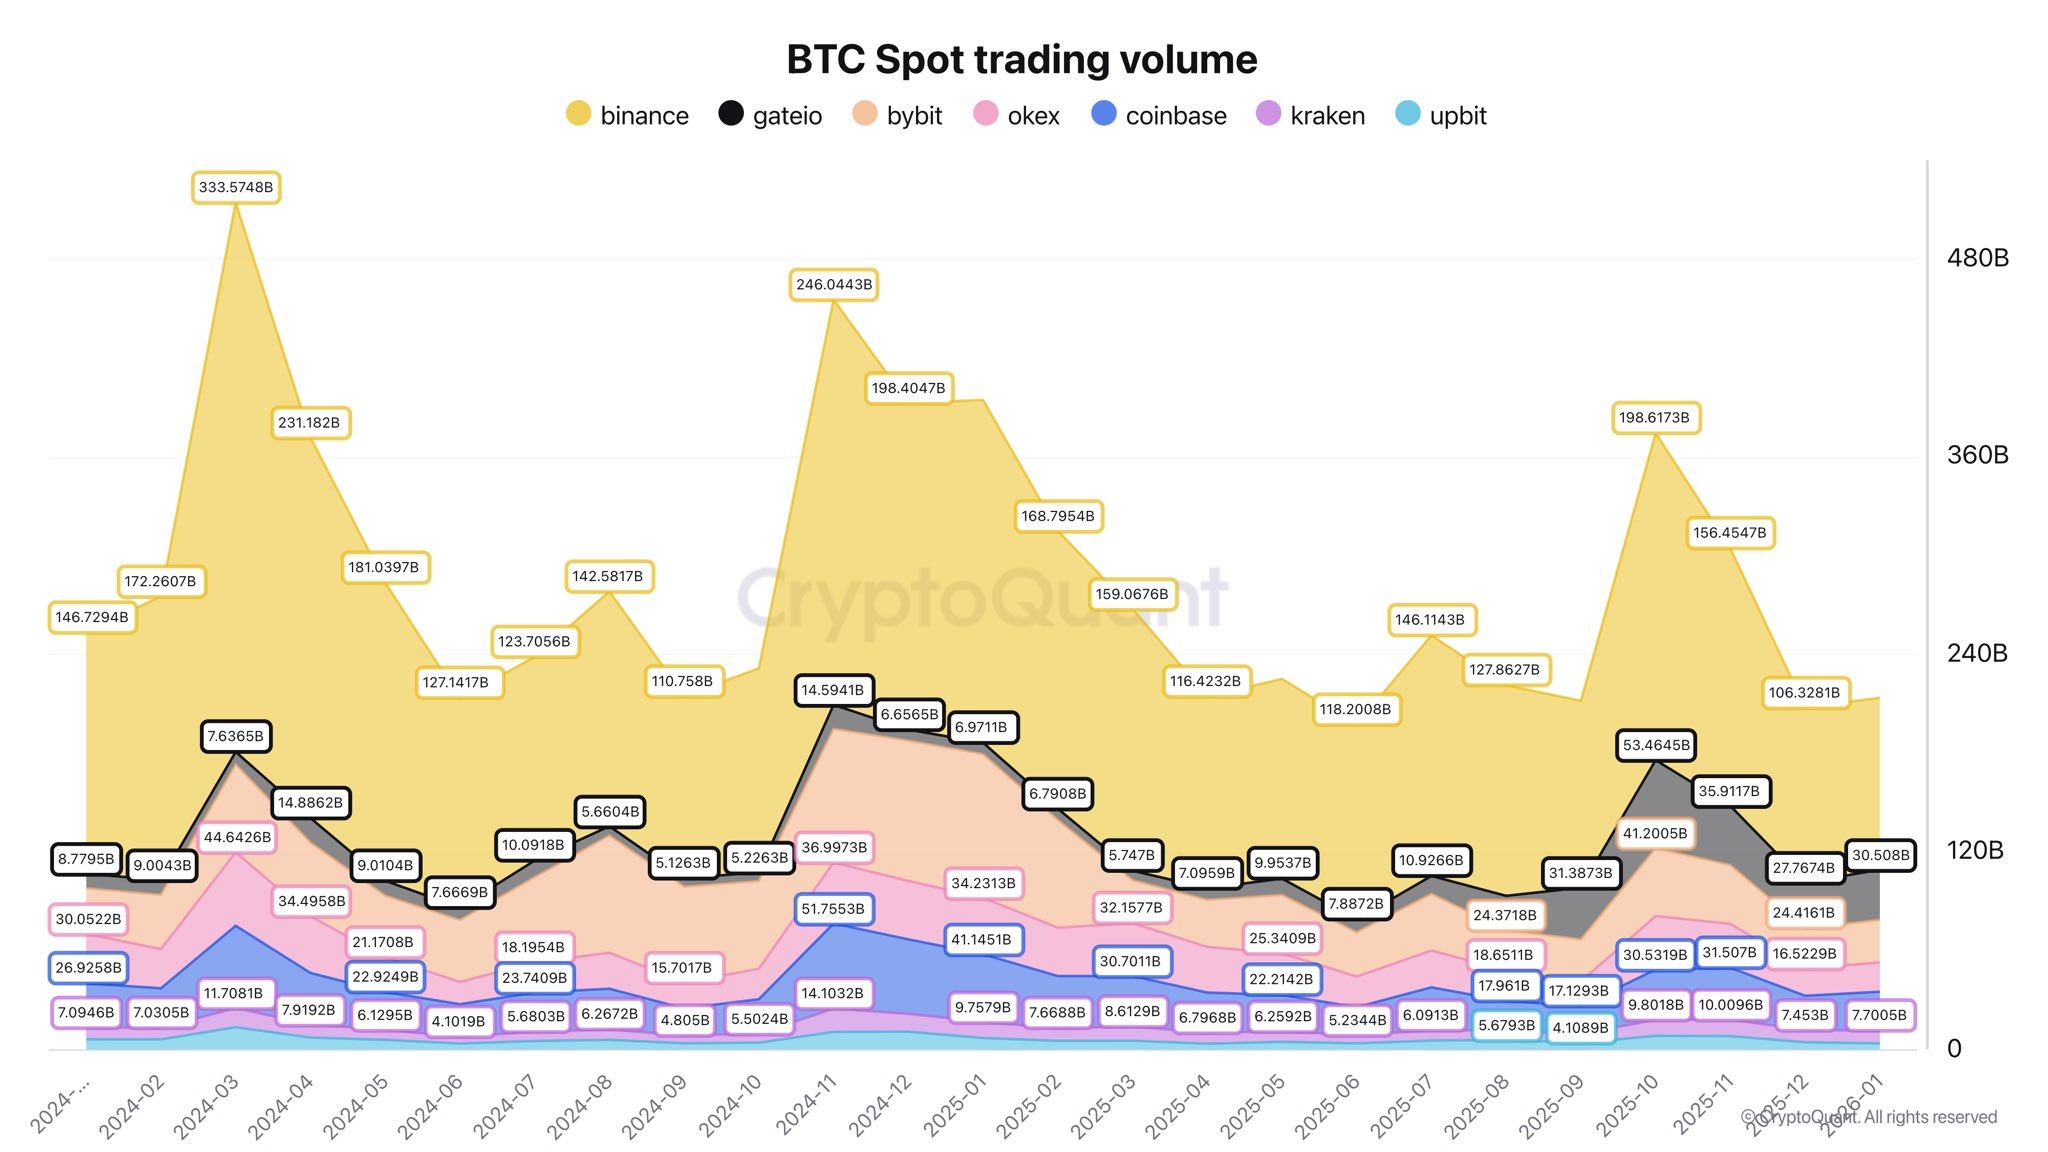
Spot Bitcoin volume on major exchanges falls to 2024 lows. Source: CryptoQuant
Dramatic Drop in BTC Spot Volumes: From 2 Trillion to 1 Trillion
Spot crypto trading volumes on major exchanges fell from approximately 2 trillion dollars in October to 1 trillion at the end of January. This signals clear investor disinterest and weakening demand. Bitcoin (BTC) dropped 37.5% from its October peak amid liquidity shortages and risk aversion, while volumes hit 2024 lows. CryptoQuant analyst Darkfost noted that spot demand has dried up and the correction largely stems from the October 10 liquidation event. BTC volume on Binance fell from 200 billion dollars to 104 billion dollars. Stablecoin outflows suppressing market liquidity and a 10 billion dollar stablecoin market cap loss are also at play.
Breaking News: BTC Falls Below MicroStrategy Cost Basis
According to recent news, Bitcoin has fallen below MicroStrategy's cost basis of 76,037$ for the first time since October 2023. It has also dropped below the 80,000$ level for the first time since April 2025 (as of 06:58 UTC, February 3, 2026, price: 78.566,72$, +%2,63 change). These developments reinforce the spot volume decline and confirm risk aversion.
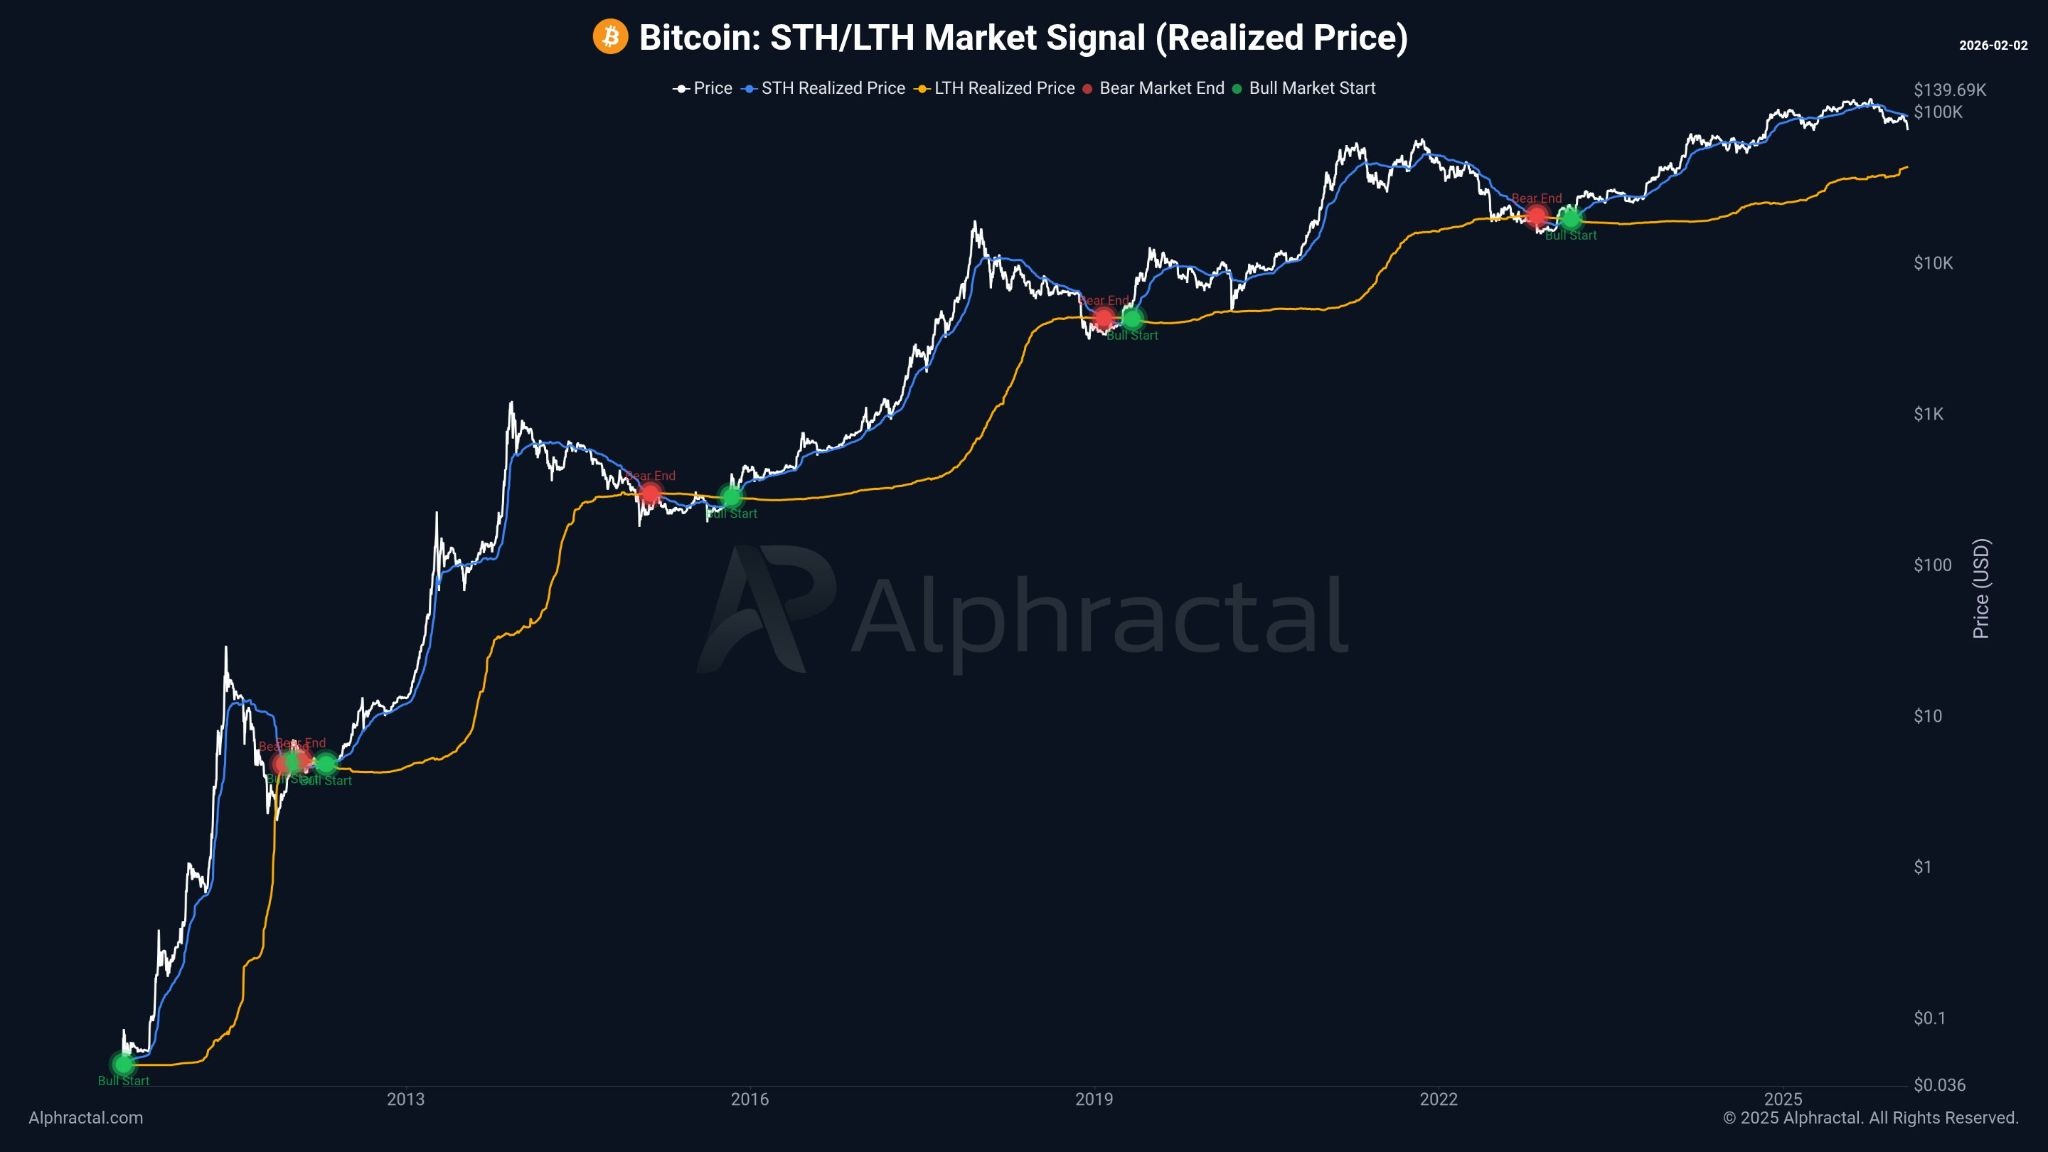
Bull and bear market signals from STH/LTH realized price. Source: Alphractal
Expert Analyses: Fed Hawkishness and Stablecoin Pressure
Arctic Digital research head Justin d’Anethan stated that short-term risks for BTC stem from the Fed's hawkish stance, strong dollar, and high real yields. Stablecoin outflows have further tightened liquidity; the 10 billion dollar market cap loss has dried up spot demand.
STH and LTH Realized Price: Bear Market Signal
Alphractal CEO Joao Wedson emphasized that the BTC price bottom will form when short-term holders (STH) are in loss (current situation) and long-term holders (LTH) suffer losses. The STH realized price needs to fall below LTH's. If the 74,000$ support breaks, a bear market may begin. This metric is critical for BTC detailed analysis.
Technical Levels: RSI Oversold and Supports
Current technical data (RSI: 28,99 - oversold, Trend: Downtrend, Supertrend: Bearish): BTC is stuck below EMA 20 (85.656$). Strong supports are as follows:
| Level | Price | Score | Distance |
|---|---|---|---|
| S1 (Strong) | 78.465,84$ | 64/100 ⭐ | -0,13% |
| S2 (Medium) | 76.306,45$ | 55/100 | -2,88% |
| Resistance | Price | Score | Distance |
|---|---|---|---|
| R1 (Strong) | 79.338,78$ | 81/100 ⭐ | +0,98% |
| R2 (Strong) | 83.548,34$ | 65/100 ⭐ | +6,34% |
If S1 breaks, the MicroStrategy level may be tested. For futures, check BTC futures.
Risks and Key Watches for Investors
Liquidations and Fed policies are suppressing volumes. In the short term, if S1 (78.4k$) doesn't hold, there's high risk of slipping to S2 (76.3k$). If long-term holders (LTH) enter loss, a bottom signal may emerge. Volume increase is essential for market recovery; otherwise, 74k bear trigger.
COINOTAG does not provide financial advisory services. This content is for informational purposes only and should not be considered investment advice. Cryptocurrency investments involve high risk.
Add COINOTAG as a Preferred Source
Add COINOTAG to your preferred sources in Google News and Search to see our coverage first.
Add on GoogleRelated Tags
AI-generated, AI-reviewed, under COINOTAG editorial oversight.