Cardano Nears $0.30 Support as RSI Divergences Signal Possible Reaction
ADA/USDT
$125,318,921.83
$0.2529 / $0.2441
Change: $0.008800 (3.61%)
+0.0012%
Longs pay

Contents
Cardano is approaching the $0.30 support zone after breaking through key weekly levels amid ongoing selling pressure. Technical indicators, including RSI bullish divergences, suggest a potential reaction at this level, with $0.39 serving as the final barrier before deeper declines.
-
Cardano nears $0.30 support after breaching multiple weekly levels, highlighting increased selling momentum.
-
RSI shows bullish divergences, indicating possible buying interest despite the downward trend.
-
Trading volume exceeds $980 million, with market cap at $14.28 billion and no immediate support between $0.39 and $0.30.
Discover Cardano’s path to the $0.30 support zone amid selling pressure and RSI signals. Explore key levels, technical insights, and market factors in this analysis. Stay informed and position your trades wisely today.
What is the Next Support Zone for Cardano in the Current Market Decline?
Cardano’s $0.30 support zone emerges as the primary target following a consistent descent through established weekly levels, including $0.90, $0.70, $0.58, and $0.46. This area, highlighted in technical charts, represents a historical reaction point with no significant barriers in between from the current $0.39 level. As of recent trading, ADA hovers near $0.398, underscoring the urgency of monitoring this zone for potential stabilization or further downside.
How Do RSI Divergences Influence Cardano’s Price Trajectory?
RSI divergences play a crucial role in assessing Cardano’s potential reversal points during declines. In the current setup, price action forms lower lows while the Relative Strength Index (RSI) records higher lows, a pattern observed in early 2023 that preceded a notable upward correction. According to analysis from Deezy on X, this bullish divergence aligns near oversold territories, suggesting underlying buying momentum could activate at the $0.30 support. Historical data from similar formations shows an average 15-20% rebound following such signals in major cryptocurrencies, though sustained selling pressure tempers expectations. Short sentences aid in scanning: the daily chart confirms sequential lower highs since August, with volume spikes indicating active participation. Experts emphasize that while divergences signal weakness in the downtrend, confirmation requires price interaction at key levels like $0.39.
Cardano moves toward the $0.30 support zone as steady selling pressure breaks weekly levels while RSI divergences signal a possible reaction.
- Cardano approaches the $0.30 support zone after breaking several weekly levels, with $0.39 as the last barrier.
- Price continues to trend lower, though RSI bullish divergences hint at a possible reaction zone.
- Trading volume stays high while structure shows steady selling pressure and no support between $0.39 and $0.30.
Cardano traded near $0.4210 after a steady drop through multiple weekly levels, and the chart now shows the $0.30 region as the next clear support zone. The structure displays repeated reactions near $0.39, and this level stands as the last marked support before the lower area. At the time of writing, ADA moved near $0.398 during intraday activity.
Cardano Moves Toward Lower Support Zones
According to analysis prepared by Ali Charts, Cardano moved down from earlier peaks near $0.90, then passed through $0.70, $0.58, and $0.46 before reaching the current zone. The chart records consistent downward movement through these levels, and the linework marks each point where the market paused before moving lower. The $0.39 area was tested earlier in the year and formed clear rebounds before the current decline.
$0.30 is where Cardano $ADA could find support! pic.twitter.com/69uPb09NEt
— Ali (ali_charts) November 21, 2025
The image shows the $0.30 region as the next support line, and the lower arrow points directly to this zone. The chart presents no major support between $0.39 and $0.30, and traders recorded past turning points at the lower level. The structure also displays steady selling pressure across the last months, and the most recent candles remain aligned with the descending path.
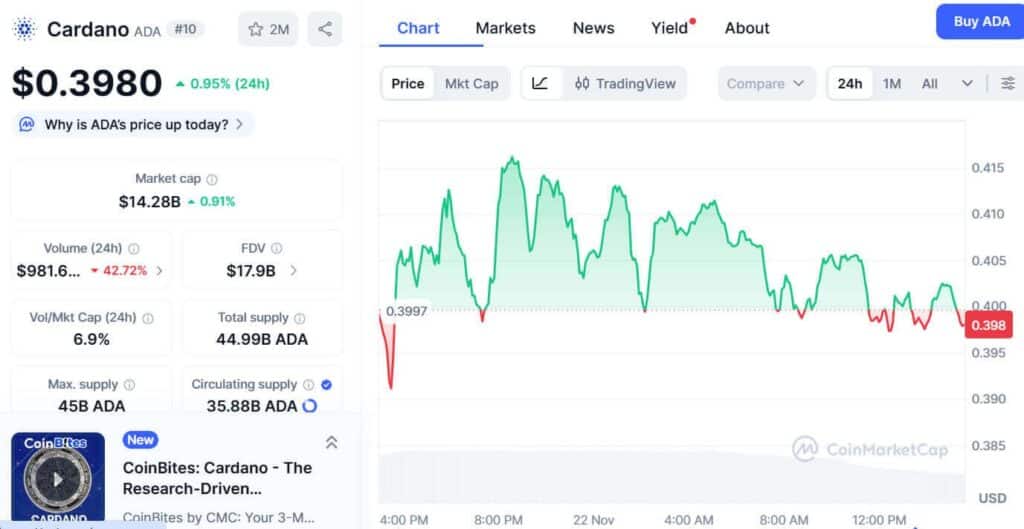
Source: CoinMarketCap
Intraday data from CoinMarketCap shows ADA trading between $0.405 and $0.398, and the chart recorded firm resistance each time price attempted to move toward the upper range. The 24-hour volume reached $981.6 million, and the market cap moved to $14.28 billion.
Market Signals and Technical Factors
According to an observation by Deezy, Cardano now forms two bullish divergences between the RSI and the price. Price records lower lows while the RSI forms higher lows, and the early 2023 pattern produced a clear upward move after the signal.
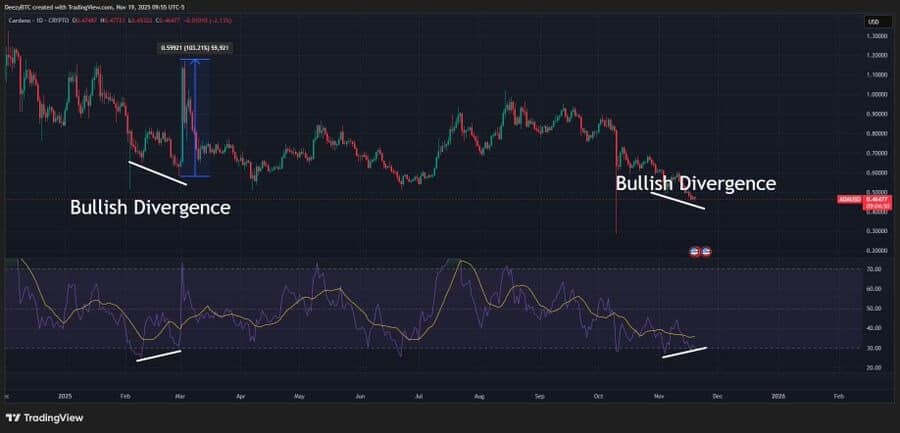
Source: Deezy(X)
Current divergence sits near the same area as ADA continues to decline. The daily chart shows a sequence of lower highs from August through November, and each move downward meets small pauses at the marked horizontal zones.
The structure stays broad, and the $0.30 region remains the area of interest as the chart records consistent pressure toward the lower boundary. Analysts note that support at $0.39 is the final barrier before the $0.30 zone, and the market now watches this range as the next key level for Cardano.
Frequently Asked Questions
What Factors Are Driving Cardano Toward the $0.30 Support Zone?
Cardano’s descent to the $0.30 support zone stems from sustained selling pressure that has eroded key weekly levels like $0.46 and $0.39. High trading volumes around $981.6 million reflect active market participation, while broader market trends contribute to the downward momentum. Technical structures confirm no intermediate supports, positioning $0.30 as a critical threshold based on historical reactions.
Can RSI Bullish Divergences Prevent Further Declines in Cardano’s Price?
RSI bullish divergences in Cardano indicate potential exhaustion in the selling trend, as seen when price hits lower lows but RSI forms higher lows. This setup, similar to early 2023, often leads to corrections of 10-20% in cryptocurrencies. However, traders should watch for price confirmation at $0.30 support to validate any reversal, ensuring a balanced approach to voice-activated queries on market dynamics.
Key Takeaways
- Critical Support at $0.30: Cardano’s chart identifies this level as the next major zone after breaching $0.39, with historical data showing past rebounds.
- RSI Signals Bullish Potential: Divergences suggest weakening downside momentum, aligning with patterns that preceded recoveries in prior cycles.
- Monitor Volume and Structure: Elevated trading volumes and consistent lower highs emphasize the need for vigilance at key levels to inform strategic positioning.
Conclusion
In summary, Cardano’s approach to the $0.30 support zone underscores the impact of steady selling pressure and technical breakdowns across weekly levels, while RSI divergences offer hope for a reaction. As the $0.39 barrier tests trader resolve, the broader Cardano price analysis highlights the importance of these zones in navigating volatility. Investors are encouraged to track upcoming developments closely for informed decision-making in the evolving crypto landscape.
Comments
Other Articles
Bitwise Files for 11 Crypto ETFs Including AAVE, NEAR, UNI Ahead of SEC Review
December 31, 2025 at 09:03 AM UTC
Altcoins Stabilize Near Lows as Bitcoin Holds Highs Amid Volume Slump
December 30, 2025 at 09:04 AM UTC
Mike Novogratz Questions XRP and Cardano’s Survival in Evolving Crypto Market
December 29, 2025 at 11:01 AM UTC