Celestia (TIA) experienced a sharp 15% decline in the past 24 hours, outpacing the broader crypto market’s 5% drop. This crash stems from a breakdown below key support levels at $0.60, increased capital outflows, and reduced network activity following the recent Matcha upgrade, as indicated by data from CoinMarketCap and Token Terminal.
-
Celestia TIA price crash: Broke below $0.60 support after 10-day consolidation, confirming bearish momentum on hourly charts.
-
Trading volume dropped 15% to $136 million, signaling weakened investor interest amid broader market fragility.
-
Active addresses fell to a monthly low of 36,100, highlighting declining on-chain activity despite the November 24 Matcha upgrade.
Celestia TIA price crash: Explore why TIA dropped 15% today, technical breakdowns, and liquidity insights for potential recovery. Stay informed on altcoin trends—read now for expert analysis on crypto market shifts.
What Caused the Recent Celestia TIA Price Crash?
The Celestia TIA price crash was triggered by a decisive break below the critical support level at $0.60, following a 10-day period of sideways consolidation. This movement amplified the token’s decline to over 15% in 24 hours, significantly outstripping the broader cryptocurrency market’s 5% capitalization loss, according to data from CoinMarketCap. Contributing factors include heightened capital outflows and subdued network engagement, which have eroded investor confidence in this modular blockchain project.
How Are Liquidity Clusters Influencing Celestia’s Recovery Potential?
Liquidity clusters for Celestia (TIA) have been accumulating above the current price levels, particularly around $0.63, $0.66, and $0.70, as observed in daily heatmap analyses from platforms like CoinGlass. These zones, formed after repeated breaks below prior supports, suggest potential upside if price follows liquidity patterns—a common dynamic in volatile crypto markets. However, the concentration of liquidity below $0.57 remains minimal, insufficient to drive further downside without broader market pressures. Expert analysis from on-chain metrics indicates that while these clusters could spark a reversal by attracting buy orders, they might also represent profit-taking opportunities for sellers, depending on order types. Short-term data shows the $0.70 level as the most distant yet robust cluster, held firm for nearly two weeks prior to the crash. This setup underscores the interplay between liquidity and price action, where dynamic shifts could either bolster a rebound or extend the bearish trend if sell orders dominate. Supporting statistics reveal that similar liquidity buildups in past altcoin corrections have led to 10-20% recoveries within days, though current weak activity tempers optimism.
Celestia crashed more than 15% in the past 24 hours, only second to Zcash [ZEC], which declined by 18%, as per CoinMarketCap. TIA’s crash was three times that of the broader crypto market, which lost 5% of its capitalization.
The daily volume also declined by 15%, about $136 million when writing. Will Celestia [TIA] continue declining, and why was the altcoin down apart from the entire crypto market crash?
TIA price action
As per the price action chart, TIA broke down below a critical sideways consolidation that had lasted about 10 days. Celestia’s price crashed past the support level at $0.60 but seemed to be building a floor at $0.56.
The clear market structure break confirmed the continuation of bear strength on the hourly chart. This followed the rejection of attempts of a reversal after the formation of a potential floor at $0.56.
The Chaikin Money Flow (CMF) was at negative 0.35. Capital outflow was increasing, extending from the 27th of November, when inflows stopped.
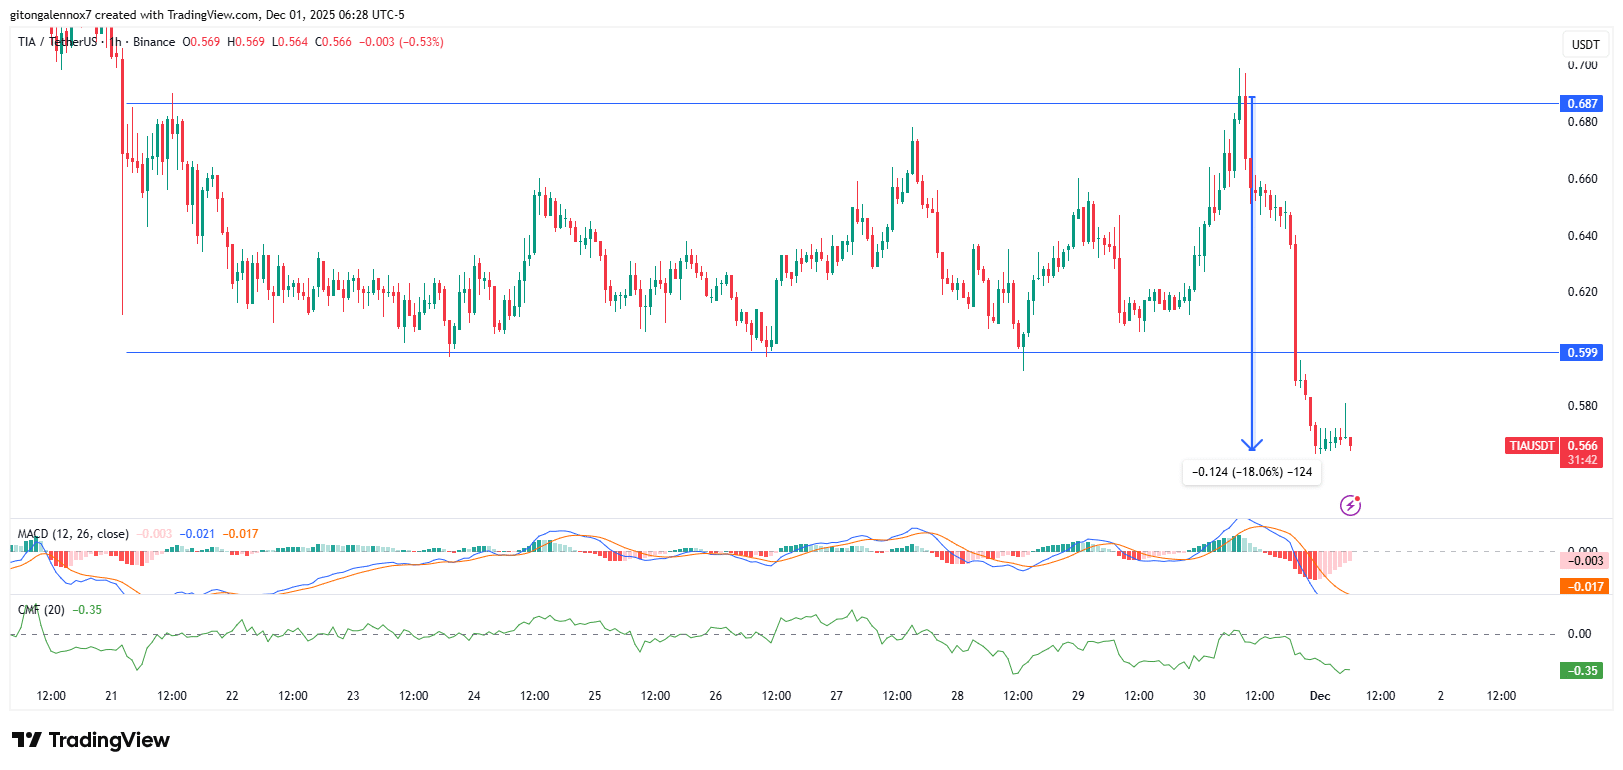
Source: TradingView
However, the MACD hinted at another outcome even though bears were breaking lower and lower.
The reading showed seller dominance, but the momentum was decreasing, which meant a reversal could not be ruled out. More analysis suggested this could not be further from the truth.
In the context of Celestia TIA price crash, the Moving Average Convergence Divergence (MACD) indicator reflects waning bearish momentum despite ongoing seller control. This divergence, where the histogram bars shrink even as price tests lower bounds, often precedes shifts in sentiment. Historical patterns in TIA’s chart show that such signals have previously led to short-term bounces of 5-8%, though confirmation from volume recovery is essential. Broader market data from CoinMarketCap reinforces that altcoins like TIA are particularly sensitive to Bitcoin dominance, currently hovering at 58%, which amplifies downside risks during corrections.
Frequently Asked Questions
Why Did Celestia TIA Experience a 15% Drop in One Day?
Celestia TIA’s 15% drop resulted from a technical breakdown below the $0.60 support after 10 days of consolidation, coupled with rising capital outflows as shown by the Chaikin Money Flow at -0.35. Data from CoinMarketCap highlights this decline was steeper than the market’s 5% loss, driven by reduced trading volume to $136 million and fleeing risk-on investments post-overnight crashes.
Can Celestia TIA Recover from Its Recent Price Crash?
Yes, Celestia TIA shows signs of potential recovery through building liquidity clusters above $0.60, particularly at $0.63 and $0.70, which could draw price upward if buy orders prevail. While current weak on-chain activity with 36,100 monthly active addresses poses challenges, decreasing MACD momentum suggests fading bear strength, potentially leading to a rebound in the coming sessions if broader crypto sentiment improves.
Key Takeaways
- Celestia TIA price crash breakdown: The token fell 15% after breaching $0.60 support, with trading volume at $136 million reflecting investor caution amid a 5% market-wide decline.
- Liquidity dynamics: Clusters above current levels at $0.63-$0.70 offer reversal potential, though minimal liquidity below $0.57 limits immediate further drops without external pressures.
- Network activity insight: Active addresses hit a low of 36,100 monthly, underscoring the need for stronger adoption post-Matcha upgrade to support long-term price stability.
Conclusion
The Celestia TIA price crash illustrates the vulnerabilities of altcoins in a fragile market environment, marked by technical breaks, liquidity shifts, and declining on-chain metrics as reported by sources like Token Terminal and CoinGlass. Despite the 15% plunge and subdued activity, emerging signals from MACD and liquidity clusters hint at possible stabilization around $0.56. As Bitcoin dominance lingers at 58%, investors should monitor broader trends closely; staying informed on such developments can help navigate future opportunities in modular blockchain innovations like Celestia.
Liquidity clusters suggest upside potential
The liquidity clusters were building to the upside each time Celestia broke below its previous levels on the daily heatmap chart.
Price follows liquidity, and for sure, there was enough of it in levels above $0.60. The zone was the support level that held the price for almost a fortnight.
The most concentrated liquidity cluster was at $0.70 and still the furthest from the price for the short-term data.
Other notable zones were $0.63 and $0.66, which could hinder appreciation, as some traders would look to take profit at these levels. However, the reaction was dependent on the type of orders present.
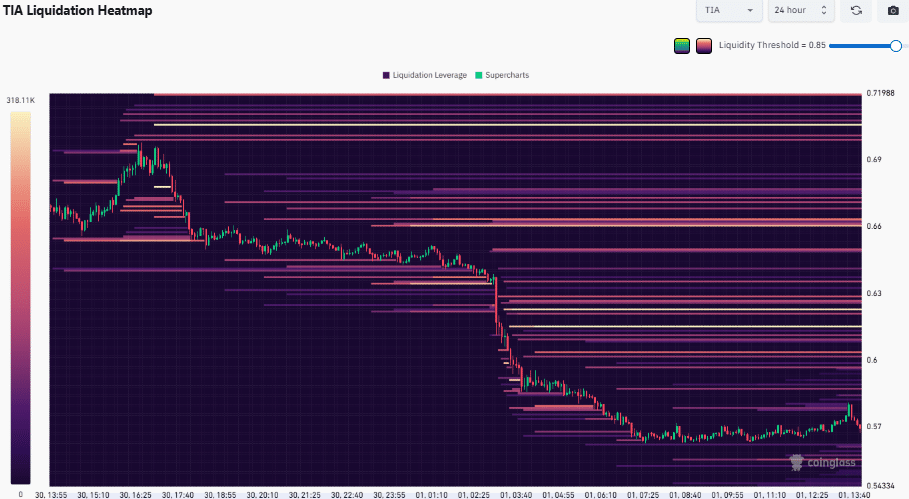
Source: CoinGlass
Still, since liquidity is dynamic, there was some building below $0.57. However, it was not significant enough to influence a further drop, but the wider market weakness could.
Liquidity clusters could ignite a reversal in this market. In the same way, the liquidity forming could be sell orders in buildup, which could influence further drops.
Why is TIA down today?
Lastly, the recent Matcha upgrade on the 24th of November was not enough to steer chain activity. Instead, users have continued to shy away from crypto and, in particular, altcoins as BTC.D traded back to 58%.
The number of active addresses reflected this weak activity, as they dropped to a new low of 36,100 per month.
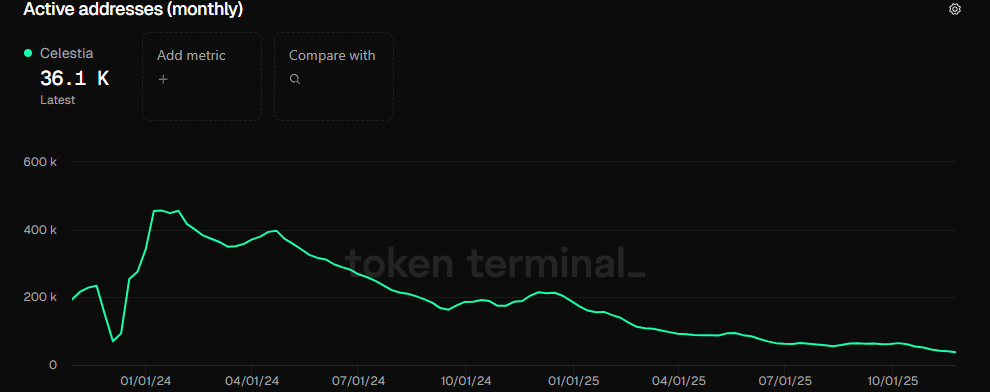
Source: Token Terminal
Furthermore, investors were fleeing risk-on assets after the overnight market crash.
Final Thoughts
- Celestia crashes 15% due to a market structure break, weak activity, and broader market fragility.
- The liquidity clusters forming above the price could ignite a reversal or fuel a further drop, depending on the type of orders.
