Chainlink Nears Key $11 Support Amid Narrowing Long-Term Patterns
LINK/USDT
$72,787,356.28
$8.69 / $8.48
Change: $0.2100 (2.48%)
+0.0011%
Longs pay

Contents
Chainlink is approaching its key $11 weekly support level, a zone that has consistently held since mid-2024 and influenced multiple market cycles. This area often triggers significant reactions, with analysts watching for potential trend reversals as the price tests this critical support amid ongoing consolidation.
-
LINK returns to a long-standing $11 support that shaped major reactions across multiple cycles.
-
Weekly structure shows lower highs while price presses into a zone that held firm since mid-2024.
-
Long-term triangle pattern narrows toward 2026 as LINK interacts repeatedly with rising support, with market cap at $8.70 billion.
Discover how Chainlink’s $11 support could signal the next crypto trend. Analyze key levels, patterns, and market data for informed decisions in 2025. Stay ahead—explore LINK’s potential now.
What is Chainlink’s $11 Weekly Support and Why Does It Matter?
Chainlink’s $11 weekly support represents a pivotal horizontal level on the price chart that has repeatedly acted as a floor for the LINK token since mid-2024. This zone has influenced price movements across various market cycles, often leading to bounces that set the stage for upward trends. As the cryptocurrency consolidates, maintaining this support could indicate renewed buyer interest and potential recovery.
Chainlink moves toward its long-standing $11 weekly support as analysts track multi-cycle structure, narrowing patterns, and ongoing market activity.
- LINK returns to a long-standing $11 support that shaped major reactions across multiple cycles.
- Weekly structure shows lower highs while price presses into a zone that held firm since mid-2024.
- Long-term triangle pattern narrows toward 2026 as LINK interacts repeatedly with rising support.
Chainlink trades near a major weekly support close to eleven dollars, a level that has held steady since mid-2024. Market watchers monitor this zone because past reactions at the same level often shaped later movements on higher timeframes. The structure now sits at a point where patience matters, as zones like this often decide the next major trend.
How Does the Multi-Month Decline Affect Chainlink’s Price Structure?
Chainlink has experienced a multi-month decline, forming lower highs on the weekly chart as it nears the $11–$12 support area. Analysis from Crypto Pulse highlights that previous interactions with this level in earlier cycles led to sustained upward movements, with the latest weekly candle holding above the key zone despite persistent downward pressure. Data from Coingecko indicates a 24-hour trading range of $11.76 to $12.57, reflecting buyer resilience near the support’s upper boundary. The token’s market capitalization stands at $8.70 billion, underscoring its position as a major player in the decentralized oracle network space.
LINK Approaches a Key Weekly Level After a Multi-Month Decline
Chainlink has moved downward for several weeks and now approaches a long-term horizontal level that appears repeatedly on the weekly chart, according to analysis prepared by Crypto Pulse. Price forms lower highs during recent candles, and the current move presses toward the $11–$12 area. Earlier cycles show steady upward moves forming after contact with this same level.
$LINK sitting on a major weekly support near 11 dollars, a level that has held strong since mid 2024. This is where patience pays off, because zones like this often decide the next big trend. 📉📈
If buyers defend this level again, it could mark the start of a fresh move upward.… pic.twitter.com/FwSntrhwy7— CryptoPulse (@CryptoPulse_CRU) November 23, 2025
Crypto Pulse notes that the latest weekly candle still holds above the marked support while downward momentum remains present. The chart does not show volume data, so the focus remains on pure structure. Chainlink trades at 12.46% with a 4.5% daily gain during the displayed period.
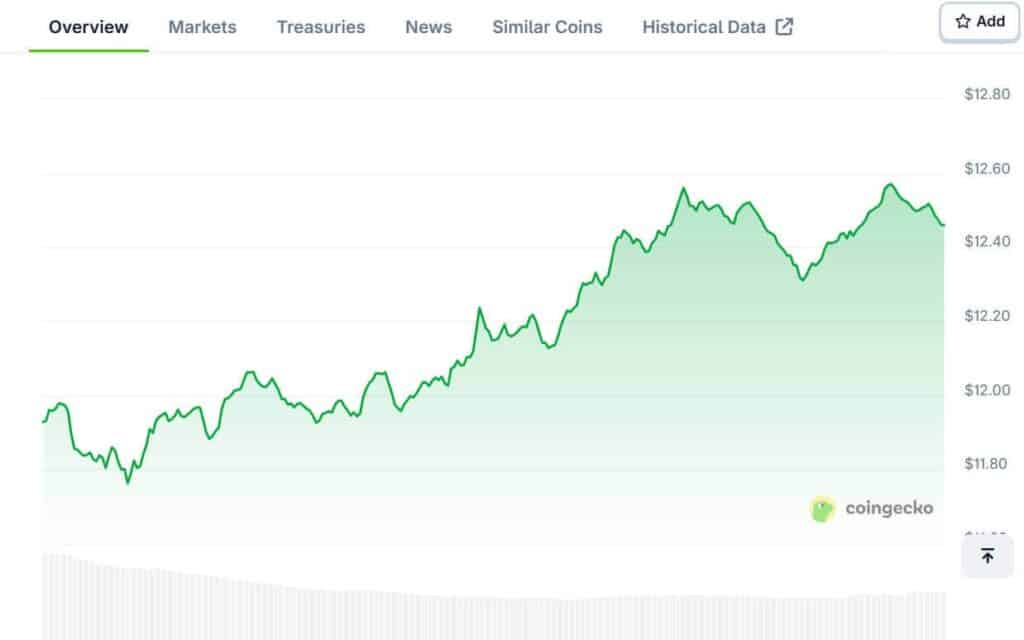
Coingecko data shows a 24-hour range between $11.76 and $12.57 as buyers maintain control near the upper side of the window. Market cap stands at $8.70 billion, and the fully diluted valuation records $12.49 billion. The current intraday curve forms a steady upward sequence with several peaks near $12.60 before easing slightly. This activity demonstrates Chainlink’s resilience within the broader cryptocurrency market, where oracle services continue to play a crucial role in smart contract execution and data reliability.
What Role Does the Long-Term Triangle Pattern Play in LINK’s Outlook?
Chainlink is operating within a symmetrical triangle pattern featuring rising support and falling resistance, as observed by World of Charts. The price has repeatedly tested the ascending trendline around the $11–$12 range, with higher lows established since 2020 against lower highs from the 2021 peak. This narrowing formation projects a potential resolution by 2026, and current price action shows a gradual drift toward the support as the pattern converges. Experts emphasize that such multi-year structures often precede significant breakouts, with historical data from platforms like Coingecko supporting the zone’s reliability across cycles. A successful defense here could align with increased adoption of Chainlink’s cross-chain interoperability protocol, potentially boosting demand for LINK tokens.
Long-Term Compression Pattern and Ongoing Market Activity
According to an observation by World of Charts, Chainlink trades inside a long symmetrical triangle with rising support and falling resistance. Price repeatedly interacts with an ascending trendline near the $11–$12 zone.
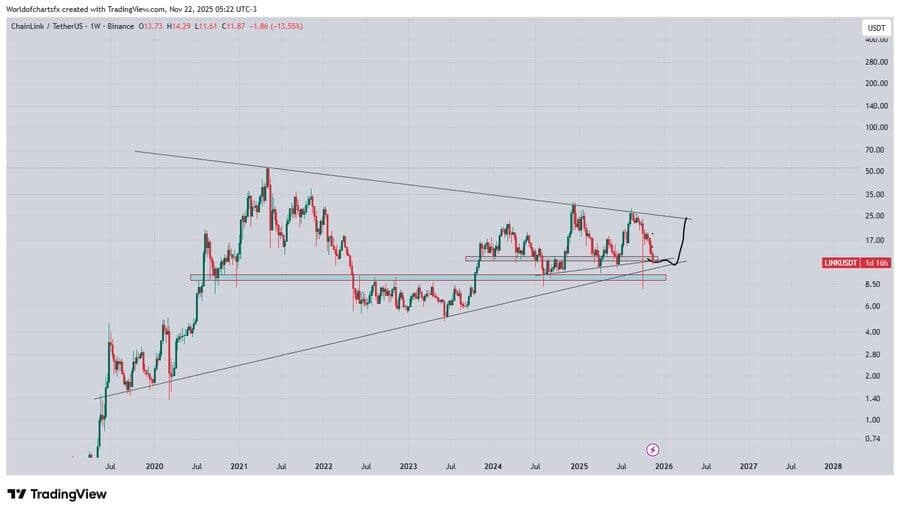
Higher lows appear along this support since 2020, while lower highs continue from the 2021 peak. Recent candles show a drift toward this long-standing level as the wedge narrows into 2026.
Analysts monitor the support closely because this area remains one of the most consistent reaction points across multiple market cycles. If buyers defend the zone again, the structure may form a fresh upward move. If not, observers wait for the next clean setup as the weekly candle closes. Chainlink’s fundamentals, including partnerships with major financial institutions for secure data feeds, further bolster confidence in this level’s significance. Data from authoritative sources like Coingecko confirms the token’s trading volume and price stability, with no signs of immediate breakdown.
Frequently Asked Questions
What Happens if Chainlink Breaks Below $11 Support?
If Chainlink’s price breaks below the $11 support, it could signal a continuation of the multi-month downtrend, potentially targeting lower levels around $10 seen in prior cycles. However, historical patterns suggest strong buying interest at this zone, as evidenced by bounces in 2024. Traders should monitor weekly closes for confirmation, with market cap implications reaching toward $8 billion if breached.
Is Chainlink’s $11 Support a Good Entry Point for Investors?
Chainlink’s $11 support presents a potential entry point for long-term investors, given its role as a multi-cycle floor and the project’s utility in decentralized finance. With a current price around $12 and a fully diluted valuation of $12.49 billion, defending this level could lead to upside toward $15–$20 resistance. Always consider broader market conditions and personal risk tolerance.
Key Takeaways
- Critical Support Zone: The $11 level has held since mid-2024, acting as a reliable floor during market volatility.
- Triangle Pattern Convergence: Narrowing since 2020, this formation suggests a major move by 2026, with rising support tested repeatedly.
- Buyer Resilience: Recent 4.5% daily gains and a $8.70 billion market cap indicate potential for upward reversal if support holds.
Conclusion
In summary, Chainlink’s approach to the $11 weekly support highlights a key juncture influenced by multi-cycle history and the ongoing symmetrical triangle pattern. As analysts from Crypto Pulse and World of Charts observe, this zone’s defense could pave the way for renewed bullish momentum in the LINK token. With robust fundamentals in oracle technology, investors should stay vigilant for the next weekly close, positioning for potential growth in the evolving crypto landscape.
Comments
Other Articles
Chainlink Price May Stay Range-Bound Near $12 Amid Fading Whale Demand
January 1, 2026 at 07:14 PM UTC
Bitwise Files for 11 Altcoin ETFs Including AAVE, UNI Amid SOL, XRP Muted Gains
December 31, 2025 at 08:47 PM UTC
UK Lowest in G7 Investments for 2025 Amid Expert Warnings on Frameworks
December 30, 2025 at 04:43 PM UTC