Chainlink Whales Accumulate Amid Key Support Retest, Signaling Potential Upside
LINK/USDT
$270,798,690.37
$10.87 / $10.33
Change: $0.5400 (5.23%)
+0.0051%
Longs pay

Contents
Chainlink whale accumulation signals growing confidence in LINK’s future, with top 100 holders adding 20.46 million tokens worth $263 million since early November, per Santiment data. This activity, amid a key price retest at $12, suggests limited downside and potential upside as spot demand absorbs selling pressure.
-
Whale holders of Chainlink (LINK) have accumulated aggressively, adding over 20 million tokens recently despite volatile price action.
-
Spot buying continues to dominate, absorbing sell pressure and indicating sustained demand for LINK.
-
Top traders show 71.4% long positions on Binance, with a Long/Short Ratio of 2.50, reflecting bullish sentiment backed by data from CoinGlass.
Discover why Chainlink whales are accumulating LINK amid price consolidation. Explore whale activity, spot demand, and trader positioning for potential breakout signals. Stay informed on LINK’s market strength today.
What is driving Chainlink whale accumulation?
Chainlink whale accumulation is primarily driven by perceived limited downside risk and strong upside potential in the LINK token. According to Santiment data, the top 100 LINK wallets have added 20.46 million tokens since early November, equivalent to about $263 million. This aggressive buying by large holders occurs even as prices remain compressed and volatile in lower ranges, highlighting a divergence between on-chain activity and market sentiment.
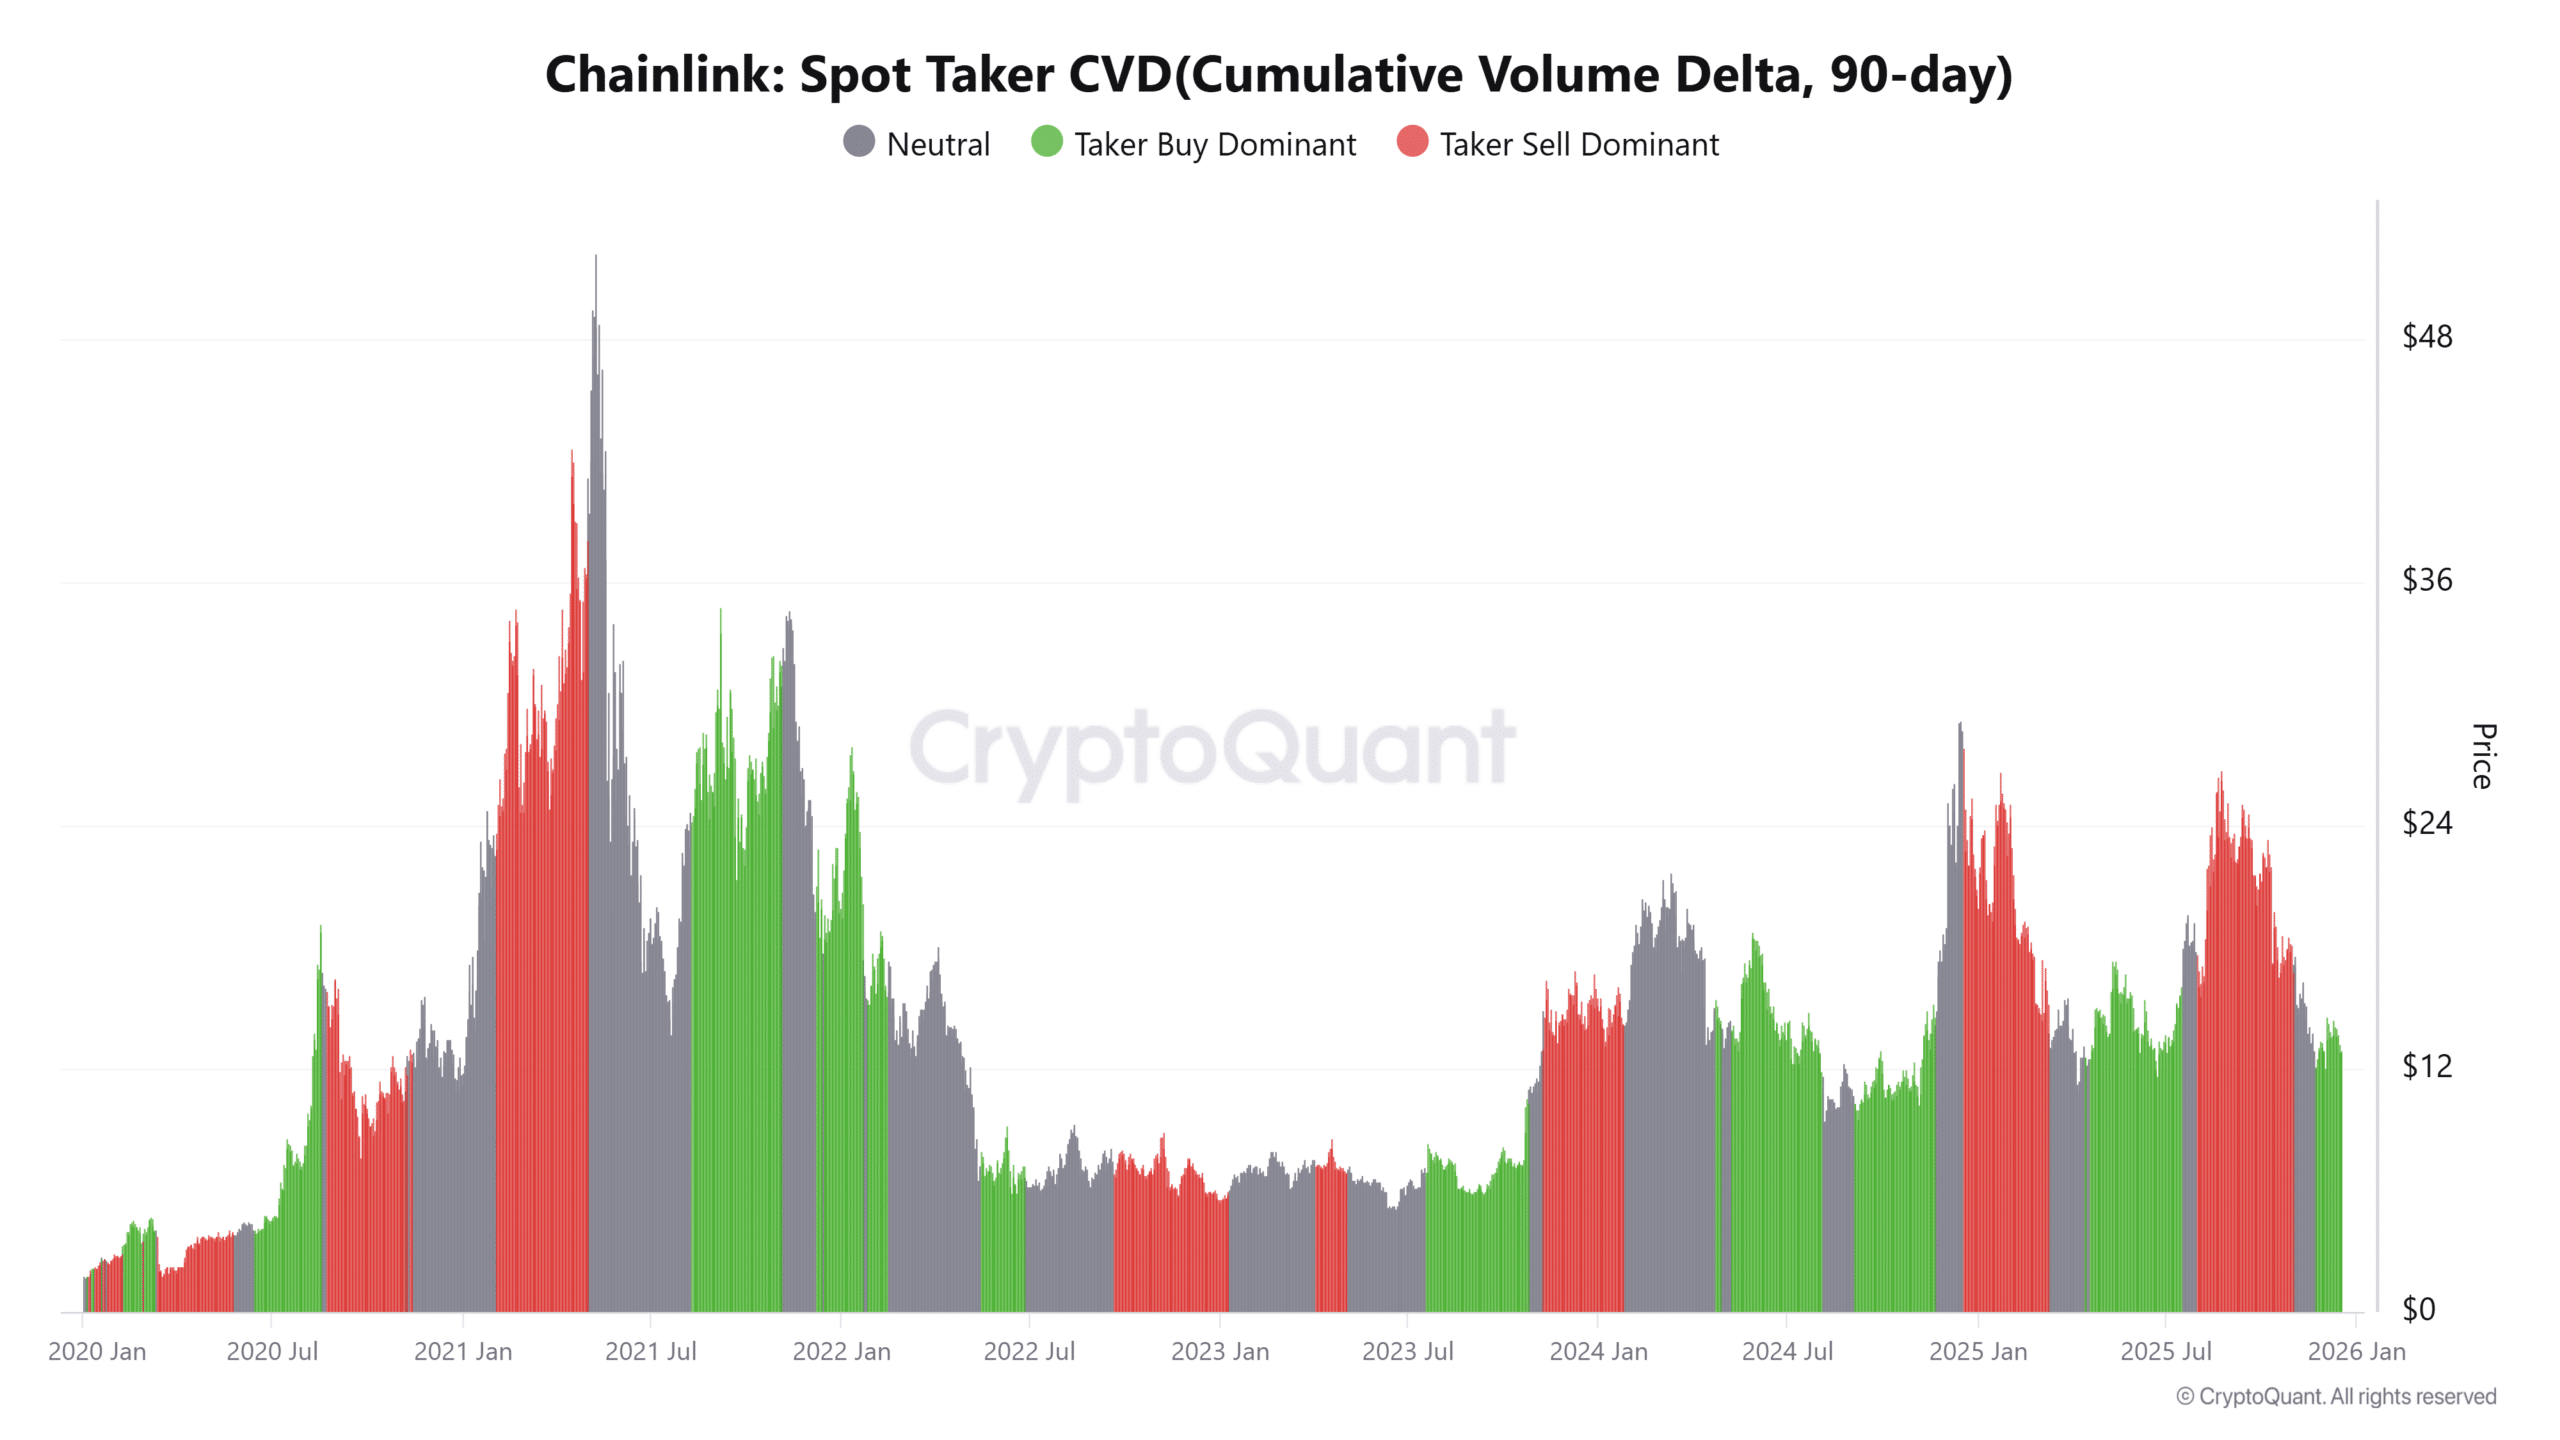
How does spot demand support Chainlink’s price stability?
Spot demand for Chainlink plays a crucial role in maintaining price stability by consistently absorbing selling pressure. Over the past 90 days, spot taker cumulative volume delta (CVD) has remained buy-dominant, as indicated by metrics from CryptoQuant. This reflects genuine market interest rather than leveraged trades, where buyers actively lift offers from the order book.
Such buying behavior is typical during accumulation phases, reducing the impact of downward moves. Short sentences highlight key aspects: sellers provide liquidity, but aggressive spot demand prevents prolonged declines. Unlike derivatives-fueled rallies, spot-led accumulation often leads to more durable price trends. Expert analysis from on-chain platforms underscores that this imbalance strengthens support levels around current prices, aligning with broader stabilization patterns for LINK.
Source: TradingView
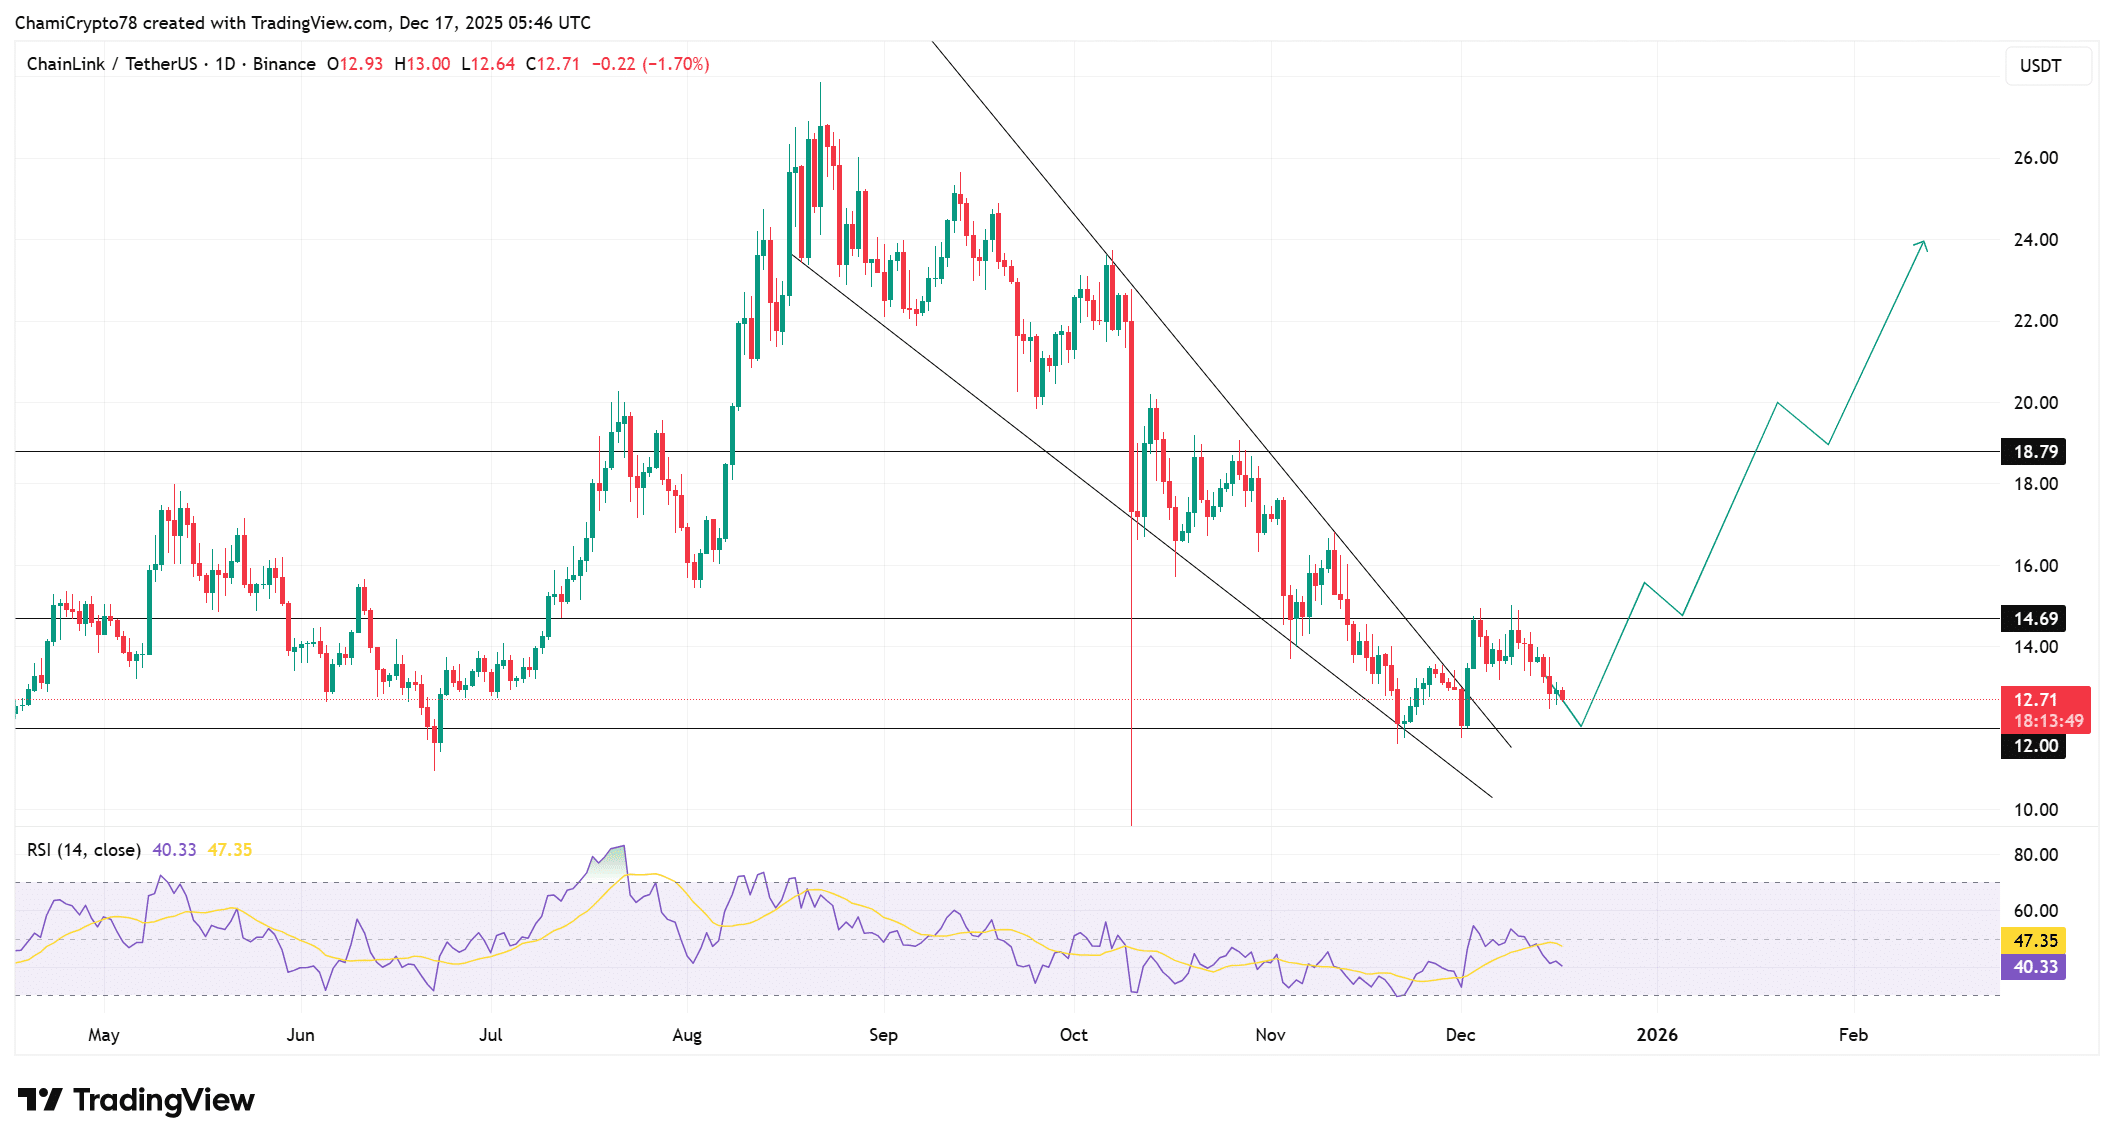
Can LINK hold its post-breakout retest?
Chainlink (LINK) recently broke above the upper trendline of a multi-month falling wedge, signaling the end of a prolonged compression phase. Following this breakout, the price has pulled back to retest the $12.00–$12.30 support zone, which now serves as former resistance turned demand area. This level is critical, as previous strong bounces originated from here, providing historical validation.
A hold above $12.00 preserves the breakout’s integrity, keeping bullish structure intact and opening paths to $14.69 resistance, followed by a supply zone near $18.79. Conversely, a breach below could target liquidity at $11.50. The Relative Strength Index (RSI) hovers around 40, indicating weakened selling momentum without renewed bullish force. Stabilization in RSI, rather than new lows, points to consolidation over continued downside, supporting the potential for a sustained recovery if key support endures.
Source: CryptoQuant
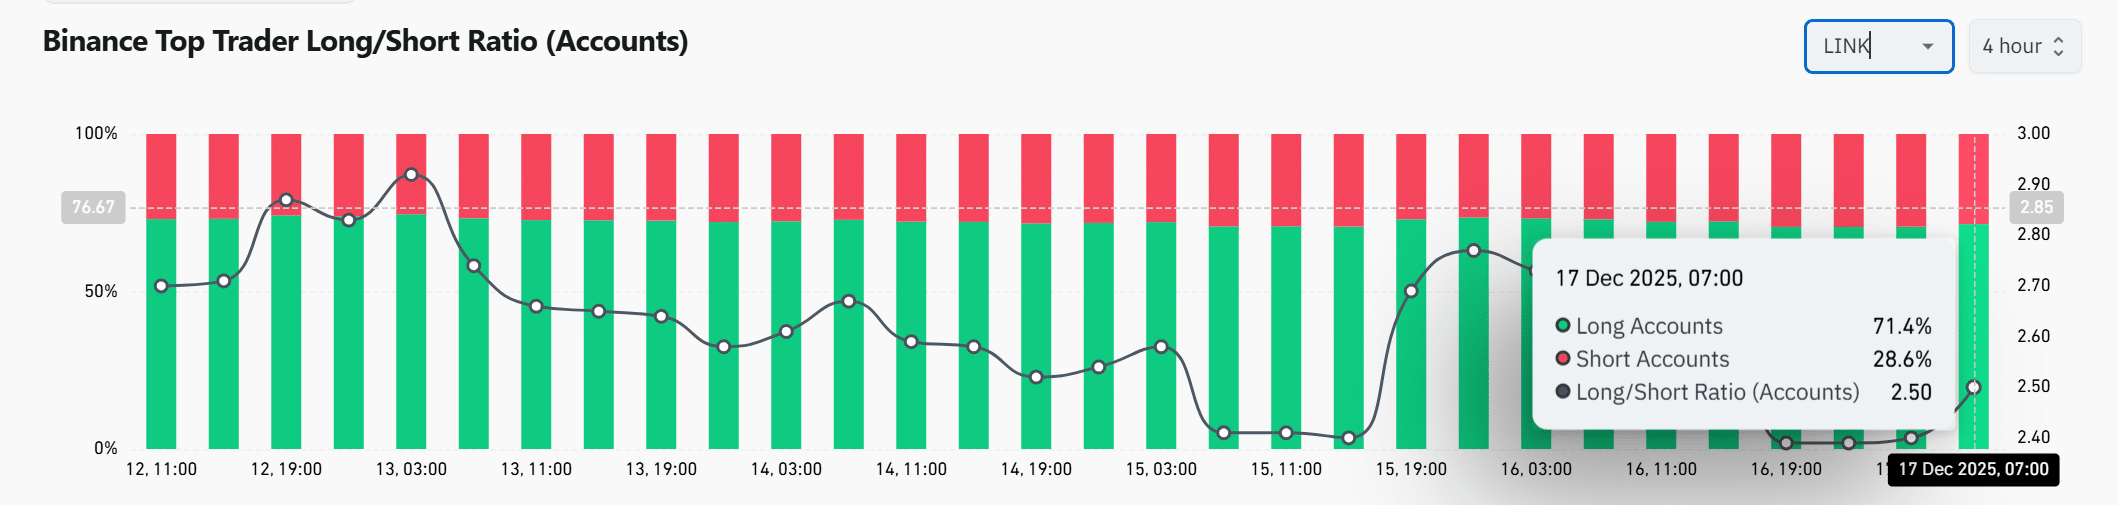
Why are top traders leaning bullish now?
Top traders on Binance exhibit strong bullish leanings, with long positions accounting for 71.4% compared to 28.6% shorts, yielding a Long/Short Ratio of 2.50 according to CoinGlass data. This positioning emerges post-breakout from the falling wedge, rather than during the preceding decline, indicating strategic bets on continuation rather than reactive chasing.
While elevated longs can amplify moves in either direction, their alignment with spot demand and whale activity reduces speculative risks. On-chain metrics reinforce this: consistent buy dominance in spot CVD suggests underlying strength. Analysts note that such trader conviction, when timed correctly, often precedes sustained uptrends. The overall setup points to a cautiously optimistic market, where positioning supports potential price expansion if support holds firm.
Source: CoinGlass
Source: CoinGlass
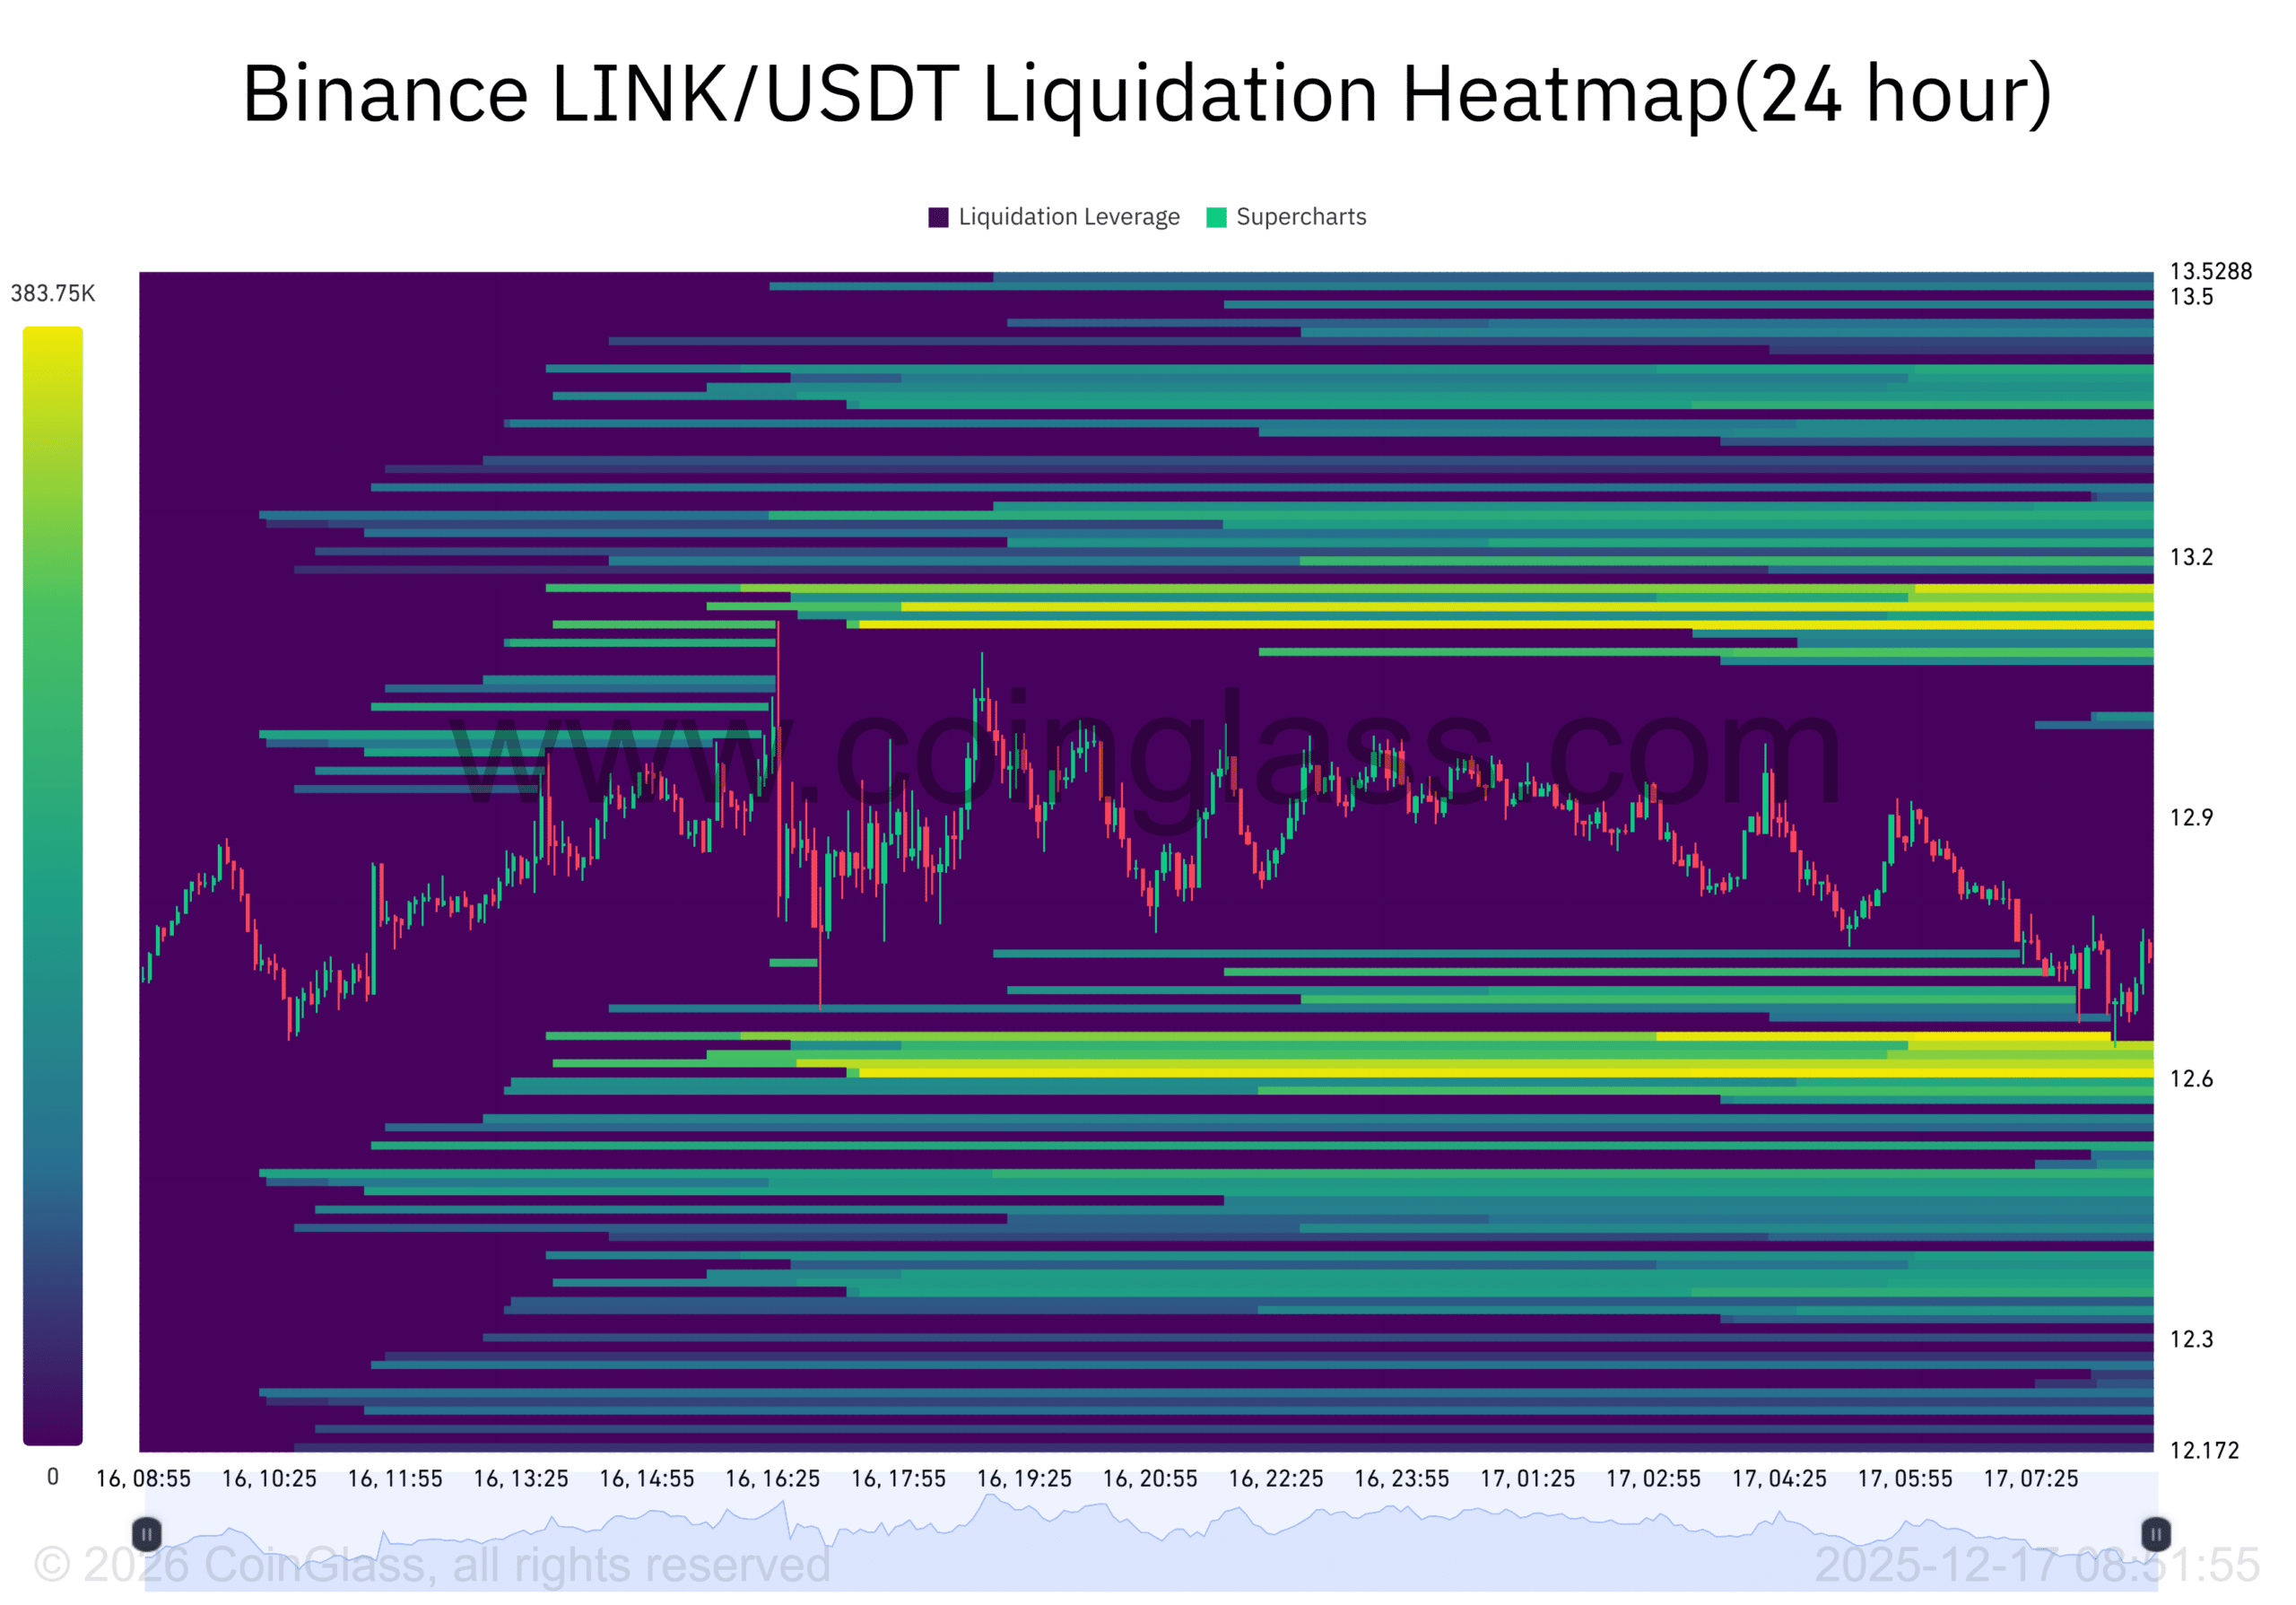
Liquidity clusters hint at sharp volatility ahead
The 24-hour liquidation heatmap for LINK reveals concentrated liquidity clusters above and below the current price, with significant pockets at $12.60 and $13.20, as shown in data from CoinGlass. Markets tend to migrate toward these zones to trigger forced liquidations, which supply immediate liquidity and often result in rapid price shifts.
Bidirectional liquidity heightens volatility potential: upward moves could cascade short liquidations for momentum, while breakdowns might cascade long liquidations. This configuration favors breakout expansion over sideways trading. As a result, Chainlink approaches a phase where market conviction could solidify in one direction, amplifying moves once initiated. Supporting data from TradingView charts aligns with this, showing price proximity to these heat zones during the ongoing retest.
Frequently Asked Questions
What does Chainlink whale accumulation mean for LINK price?
Chainlink whale accumulation indicates large investors are building positions, viewing downside as limited compared to upside potential. Santiment reports 20.46 million LINK added by top holders since November, worth $263 million. This often precedes rallies, but does not assure short-term gains; it signals long-term confidence amid current consolidation.
Is Chainlink’s spot demand a sign of upcoming recovery?
Yes, Chainlink’s strong spot demand, with buy-dominant CVD over 90 days per CryptoQuant, suggests buyers are actively countering sellers. This absorption reduces downside pressure and supports stabilization. For voice searches, it means real interest is building, potentially leading to a recovery if the $12 support holds during this retest phase.
Key Takeaways
- Whale Activity Builds Strength: Top LINK holders added 20.46 million tokens, reflecting conviction despite price volatility.
- Spot Demand Absorbs Pressure: Buy-dominant CVD indicates sustained interest, limiting downside and favoring accumulation.
- Trader Bullishness Aligns: 71.4% long positions on Binance suggest upside potential; monitor $12 support for breakout confirmation.
Conclusion
Chainlink’s whale accumulation and spot demand signals, combined with bullish trader positioning, point to underlying strength amid the current price retest. Data from Santiment, CryptoQuant, and CoinGlass demonstrate growing market conviction, with liquidity clusters poised for volatility. As LINK defends the $12 zone, investors should watch for sustained support to validate recovery prospects, positioning for potential advances toward higher resistances in the coming sessions.
Add COINOTAG as a Preferred Source
Add COINOTAG to your preferred sources in Google News and Search to see our coverage first.
Add on GoogleRelated Tags
Comments
Other Articles
Coinbase (COIN) bounces 10%, Solana, LINK, SUI outperform as bitcoin (BTC) holds $80K
May 8, 2026 at 08:59 PM UTC
Chainlink Price May Stay Range-Bound Near $12 Amid Fading Whale Demand
January 1, 2026 at 07:14 PM UTC
Bitwise Files for 11 Altcoin ETFs Including AAVE, UNI Amid SOL, XRP Muted Gains
December 31, 2025 at 08:47 PM UTC