Crypto Crash: Total3 713M$, BTC 68K Bottom
BTC/USDT
$19,113,081,726.22
$81,300.00 / $78,754.65
Change: $2,545.35 (3.23%)
+0.0019%
Longs pay

Contents
The crypto market has largely pulled back from the 2024-2025 rally that began after the 2024 US presidential elections and lost about 40% of its value from the October 2025 peak. Total3 Market Cap, the total market value excluding ETH and BTC, rose 91% after the November 5, 2024 election results, reaching 1.16 trillion dollars in December 2024. It was at 600 billion dollars before the election. The market rose to 1.13 trillion dollars in January 2025 and traded sideways, then peaked at 1.19 trillion dollars in October 2025 before collapsing. At the time of publication (February 21, 2026), Total3 Market Cap is around 713 billion dollars, at early November 2024 levels, and shows no signs of recovery.
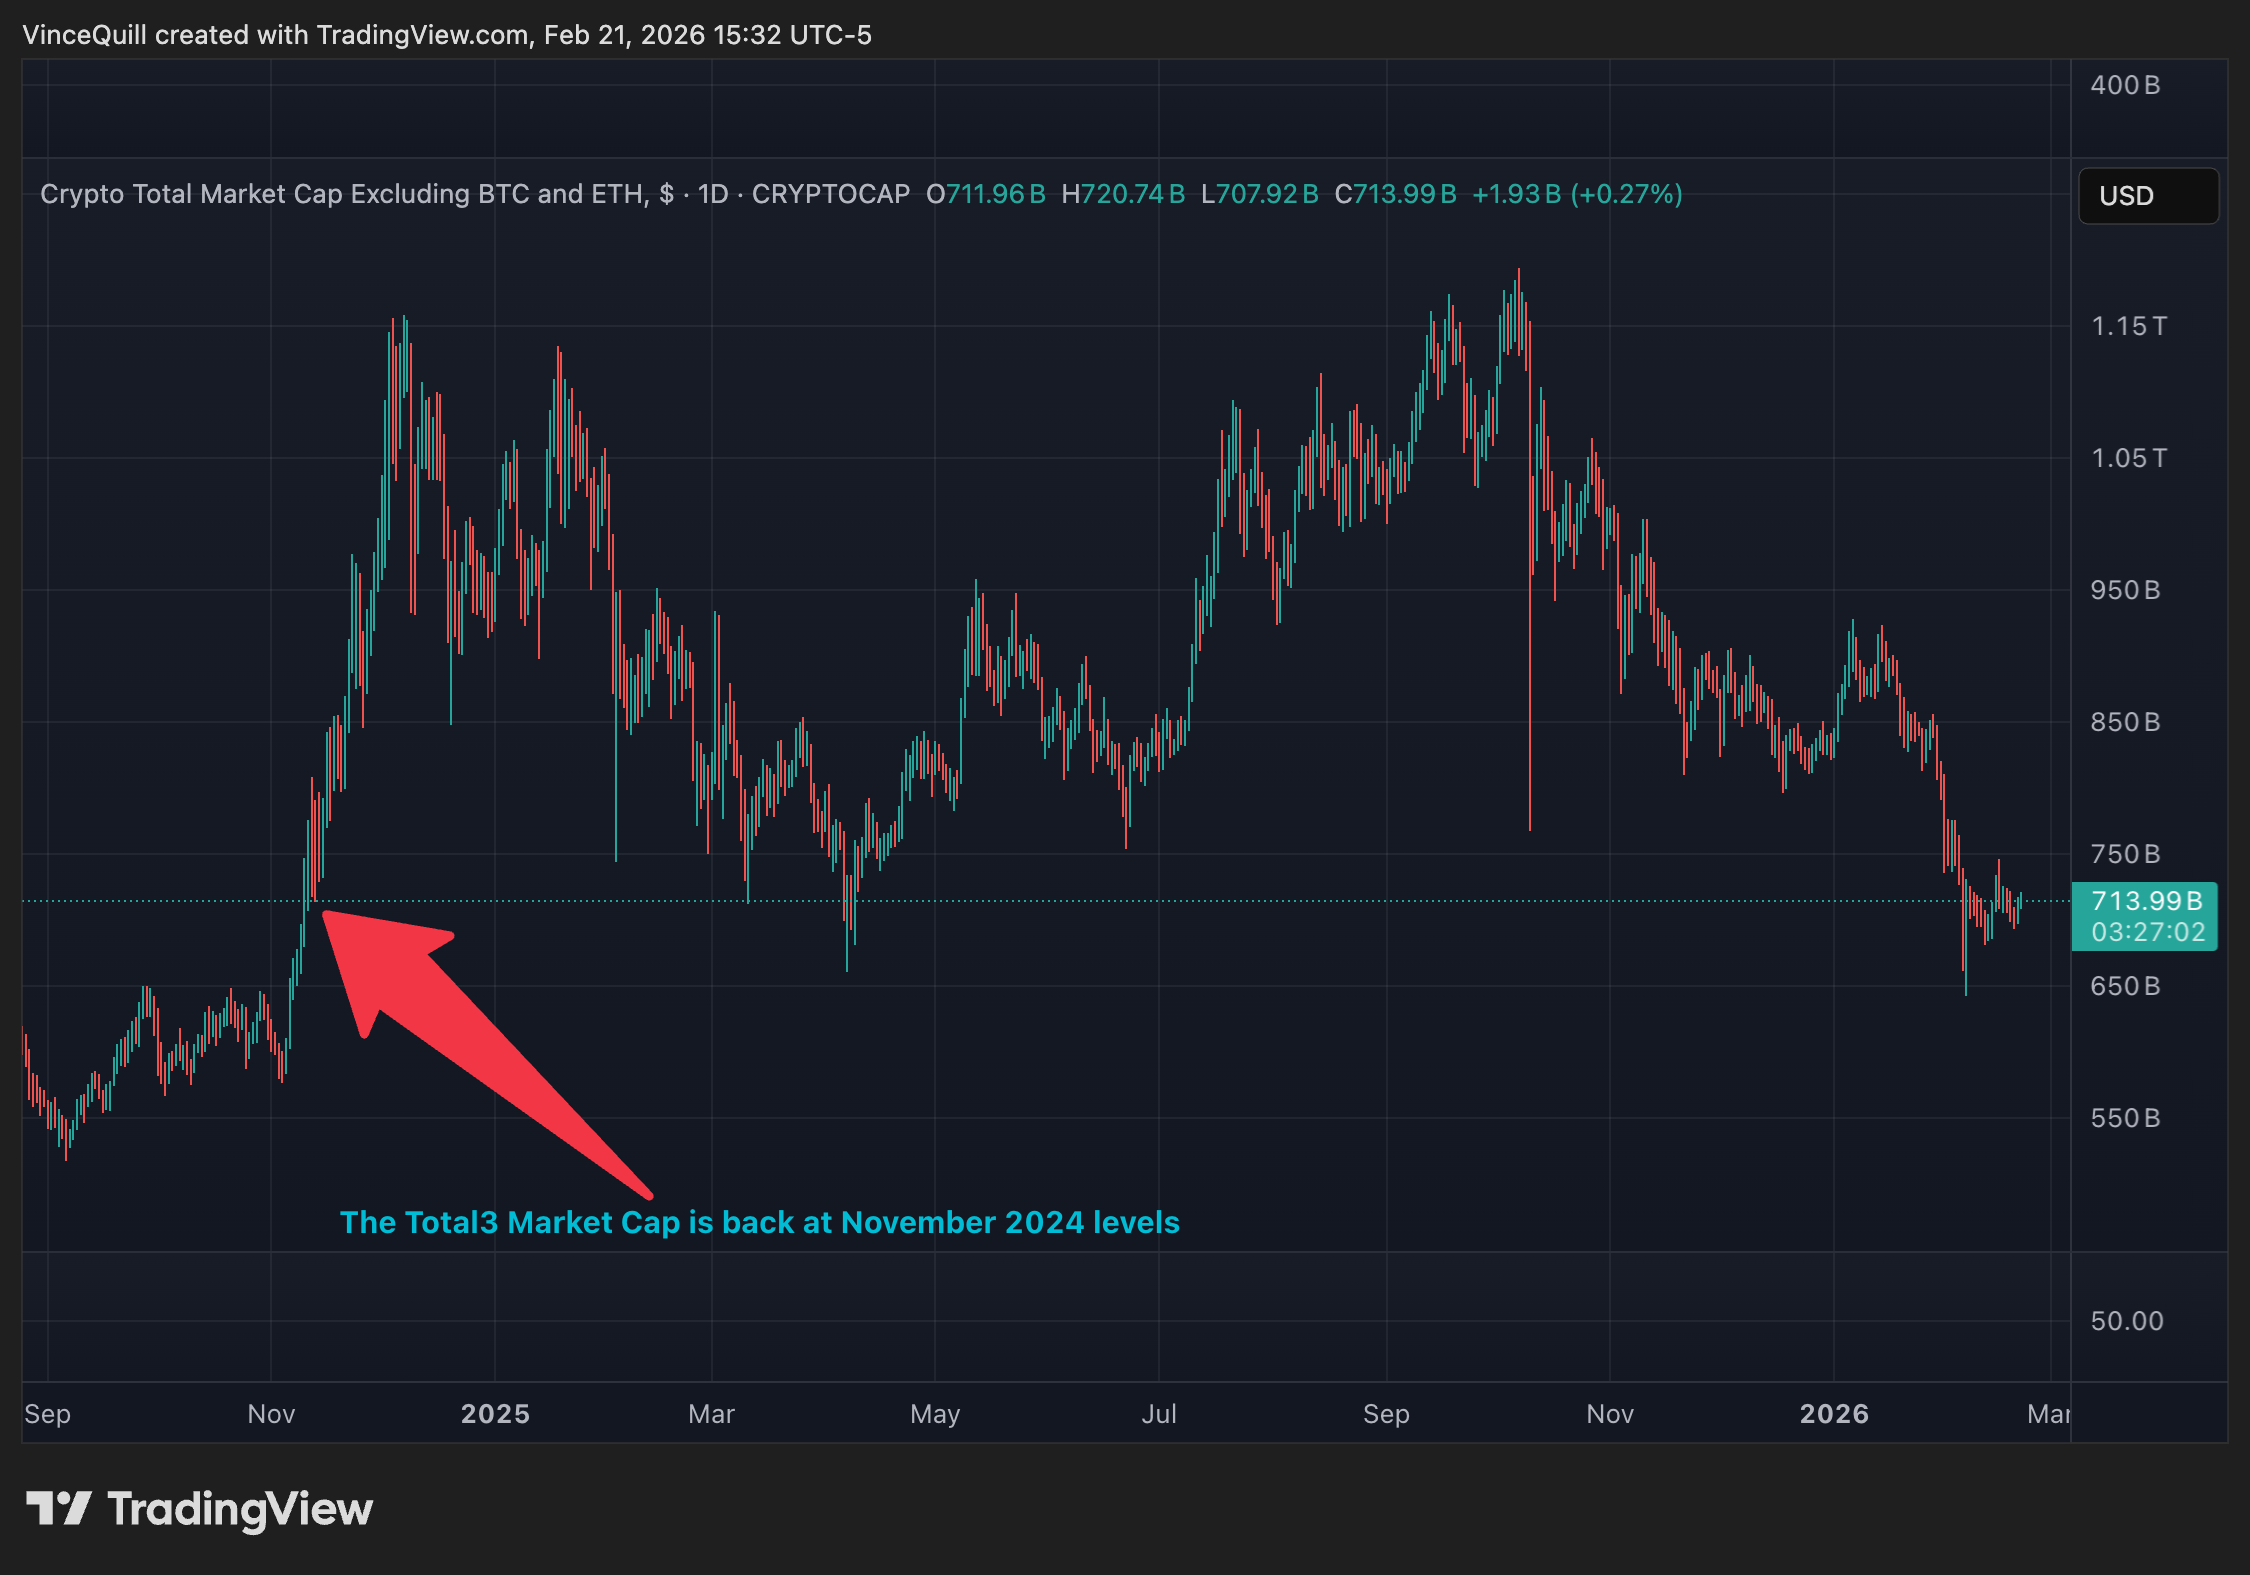
Total3 Market Cap from September 2024 to February 2026. Source: TradingView
Main Reasons for the Total3 Market Cap Collapse
BTC fell 50% from the peak, bottomed at 60 thousand dollars, then recovered limitedly to 68 thousand dollars. ETH eroded 60% from its approximately 5 thousand dollar peak in August 2025. Macro pressures, interest rate hikes, and the bursting of the altcoin bubble triggered this decline. Total3, being altcoin-heavy, was the fastest rising in the rally and the hardest falling in the crash.
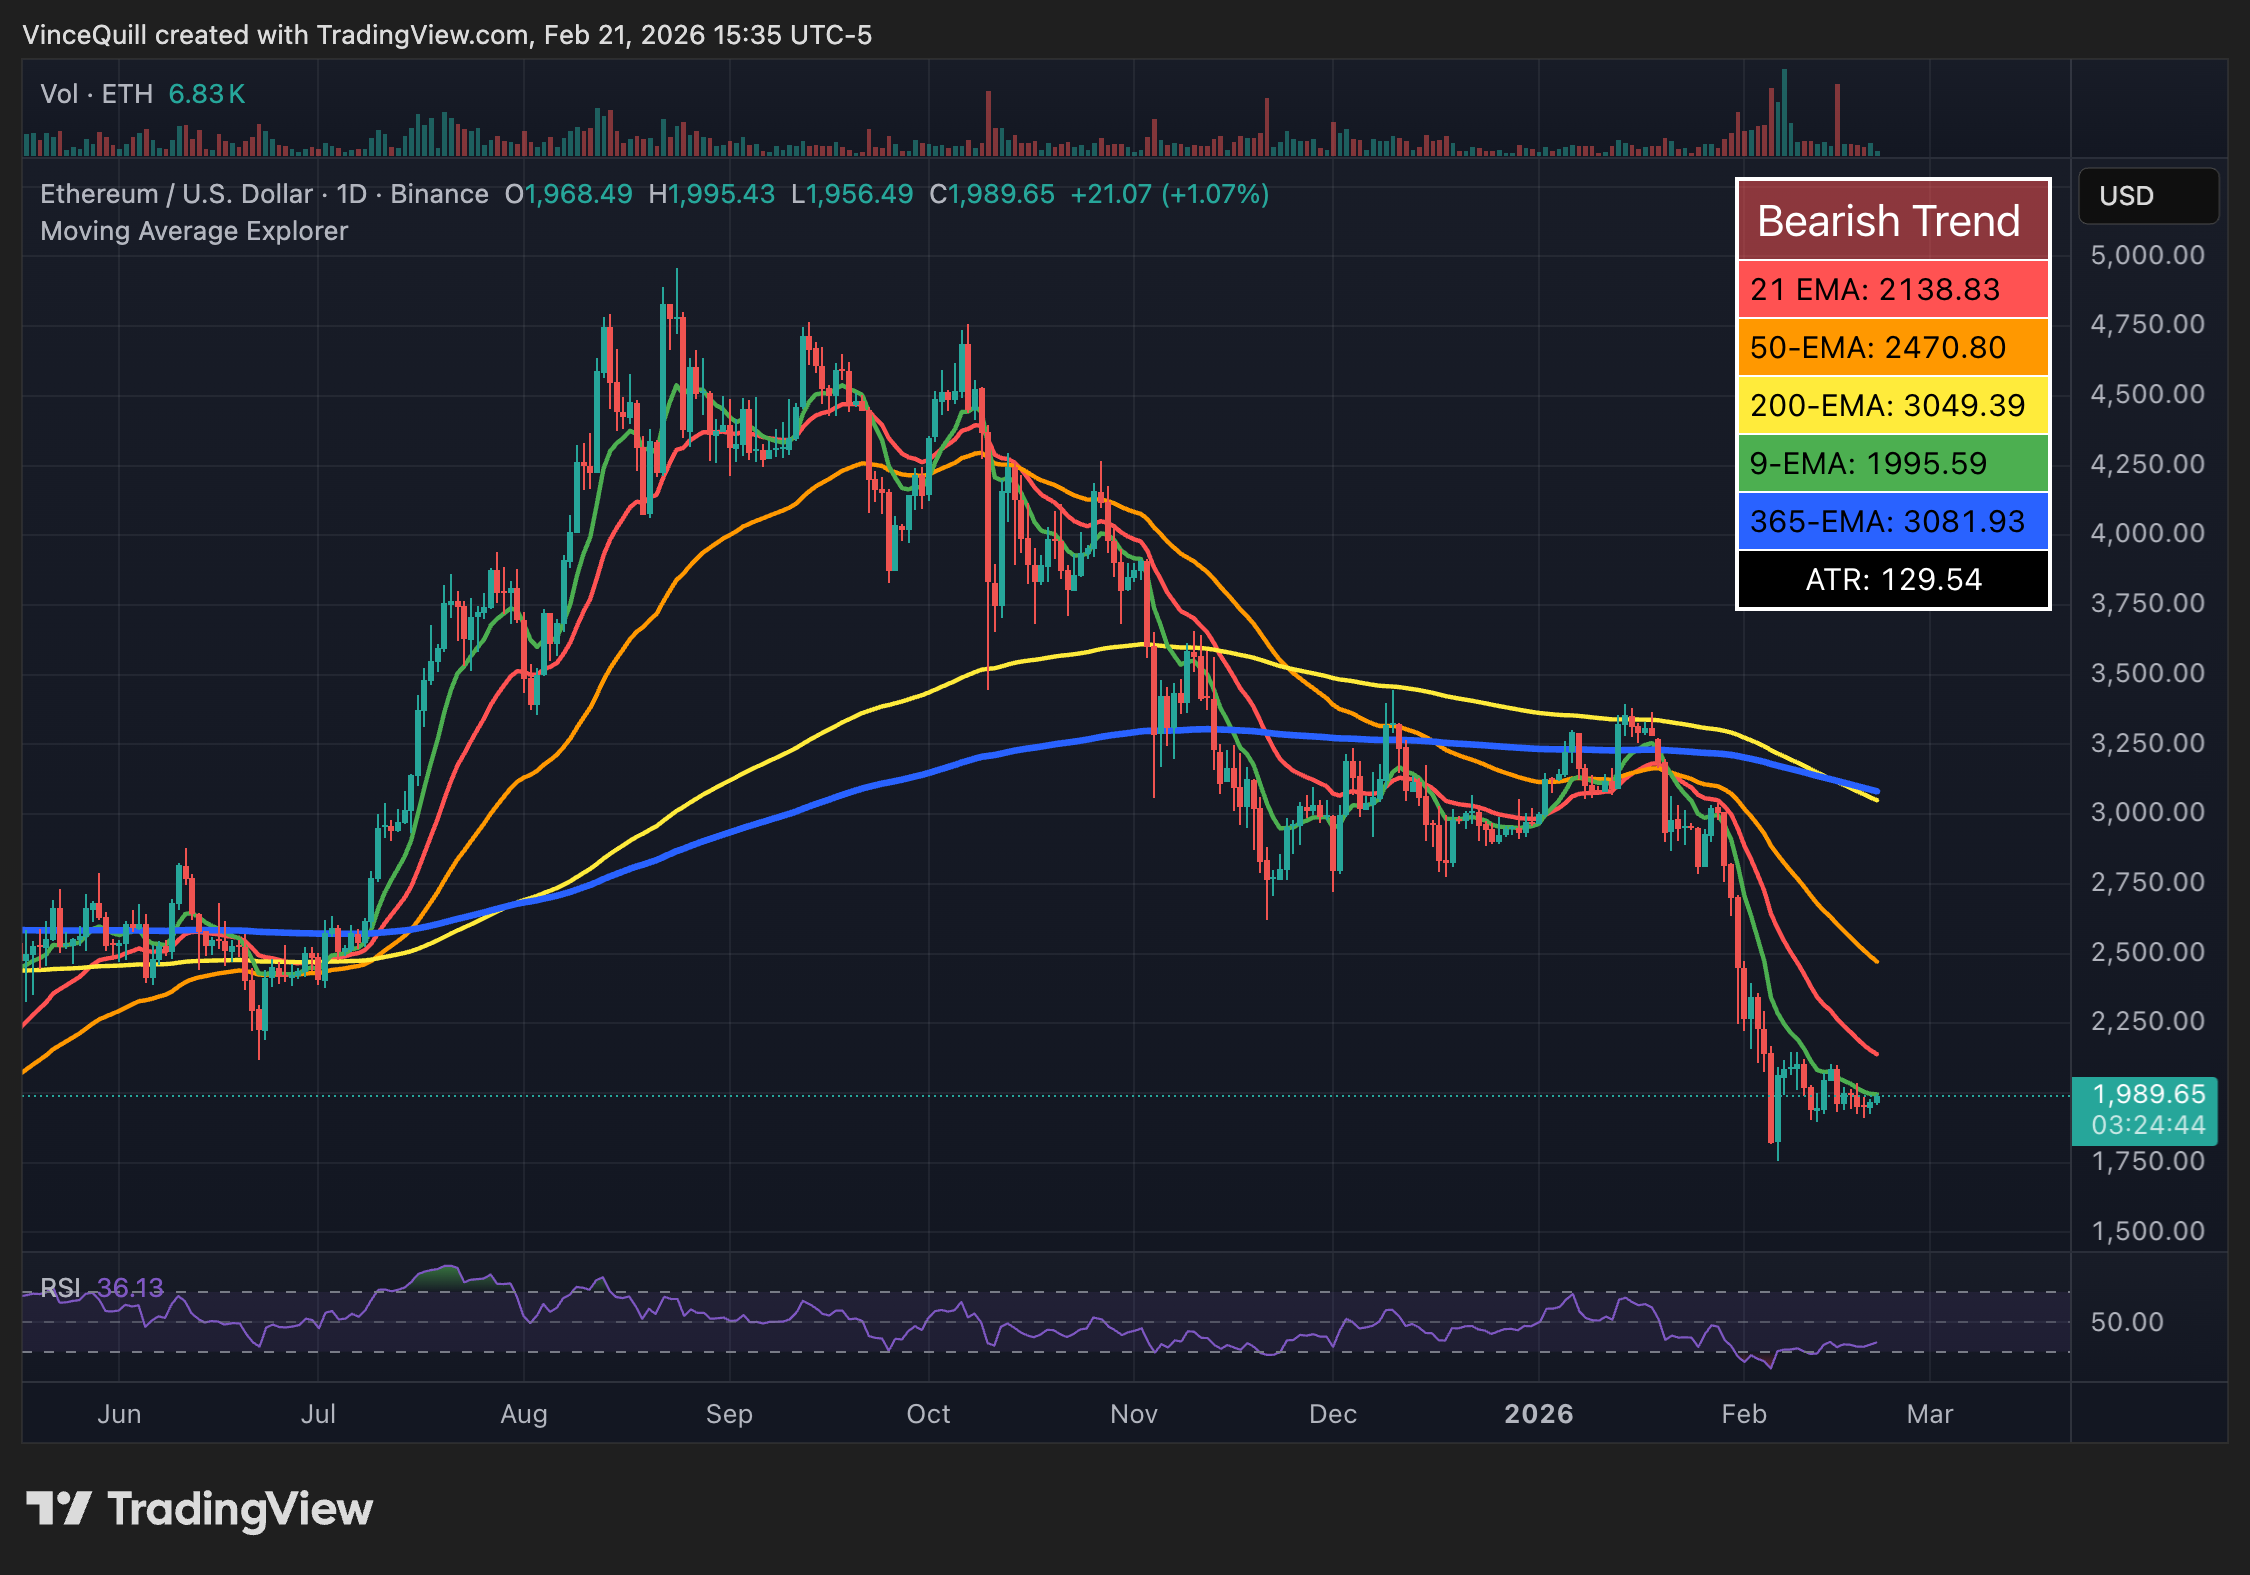
Ether price collapse from August 2025 peak. Source: TradingView
Fear Index at Historical Low for BTC Investors
Investor sentiment at multi-year lows; CoinMarketCap Fear and Greed Index at 14 (extreme fear) at time of publication, fell to historical low of 5 on February 5. This level resembles the 2022 bear market bottom. Despite peak Google searches for 'Will Bitcoin go to zero?', BTC detailed analysis shows institutional buying.
Spot BTC ETFs: Institutional Buying Continues Despite Fear
The 12 spot Bitcoin ETFs in the US recorded net inflows in the shortened week of February 20 due to Presidents' Day holiday. Institutional buyers are accumulating BTC while macro data (declining inflation) signals recovery. This highlights institutional confidence in contrast to retail panic.
BTC Technical Analysis: RSI 38.92 and Strong Supports
Current BTC price: 68,211$. 24h change: +0.71%. RSI 38.92 (near oversold), trend down, Supertrend bearish. EMA 20: Need close above 71,053$ for recovery. BTC futures data shows similar pressure.
| Level | Price | Score | Distance | Sources |
|---|---|---|---|---|
| S1 (Strong Support) | 67,932$ | 66/100 ⭐ | -0.95% | Previous Close, Ichimoku |
| S2 | 64,532$ | 64/100 ⭐ | -5.90% | Fib |
| R1 (Strong Resistance) | 69,388$ | 75/100 ⭐ | +1.18% | BB Middle, SMA20 |
| R2 | 71,018$ | 64/100 ⭐ | +3.55% | Swing High, EMA20 |
Future Risks for ETH and Altcoins
ETH down 60% at bottom in ETH/BTC pair. Altcoins are dragging Total3 down. ETH detailed analysis on hold; rally after ETF approval ended. Recovery will be BTC-led.
Critical Levels and Recommendation for the Market
If S1 67.9k breaks, 64k can be tested. Above R1 69.4k positive. Buying opportunity for long-term holders, high short-term volatility.
Add COINOTAG as a Preferred Source
Add COINOTAG to your preferred sources in Google News and Search to see our coverage first.
Add on Google