ETH MVRV Z-Score -0.42: Capitulation Signal

Contents
Ethereum’s MVRV Z-Score declined to the -0.42 level, signaling a mass selling zone; this metric measures whether assets are overvalued or undervalued by comparing market value to realized value. CryptoQuant analyst Joao Wedson stated that this indicates a clear capitulation process in Ethereum, but it is not as intense as the bottom levels in the 2018 and 2022 bear markets (-0.76). ETH price fell 30% over the last two weeks, dropping to 1,825 dollars on Friday and reaching 2,100 dollars on Monday with a slight recovery. The current price is at 2,011 dollars, down 3.38% in 24 hours, with RSI at 29.97 level giving an oversold signal.
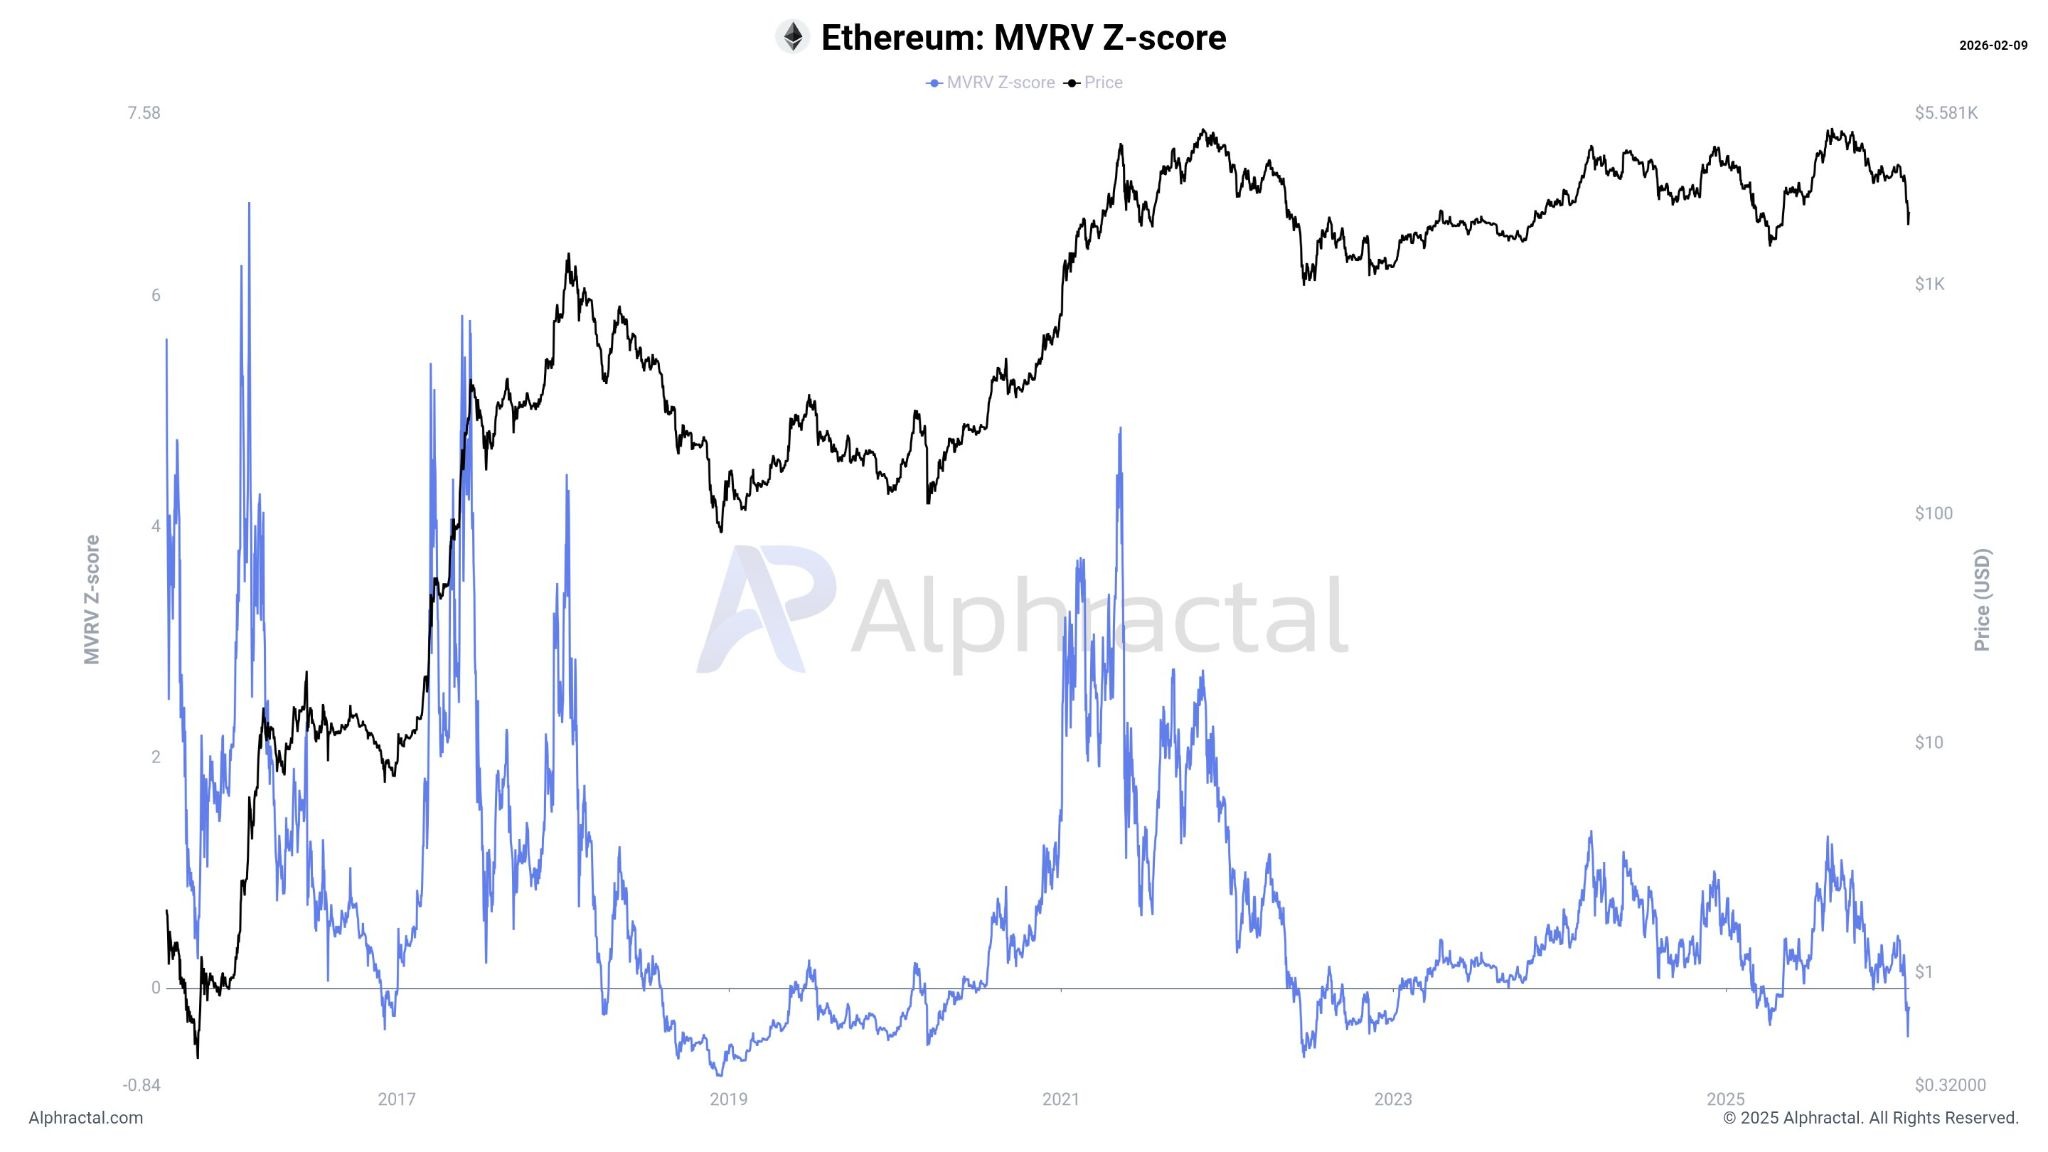
Ether MVRV Z-Score tanks below zero in capitulation. Source: Alphractal
Ethereum MVRV Z-Score at Capitulation Level
HashKey Group researcher Tim Sun stated that the metric is reliable for identifying bottom zones, Ethereum’s fundamental indicators remain strong, but there is a risk of further downside due to April tax season liquidity pressure. MN Fund founder Michaël van de Poppe and Bitrue research leader Andri Fauzan emphasized that negative MVRV has created buying opportunities in past cycles. This level stands out as a critical buying zone for ETH detailed analysis.
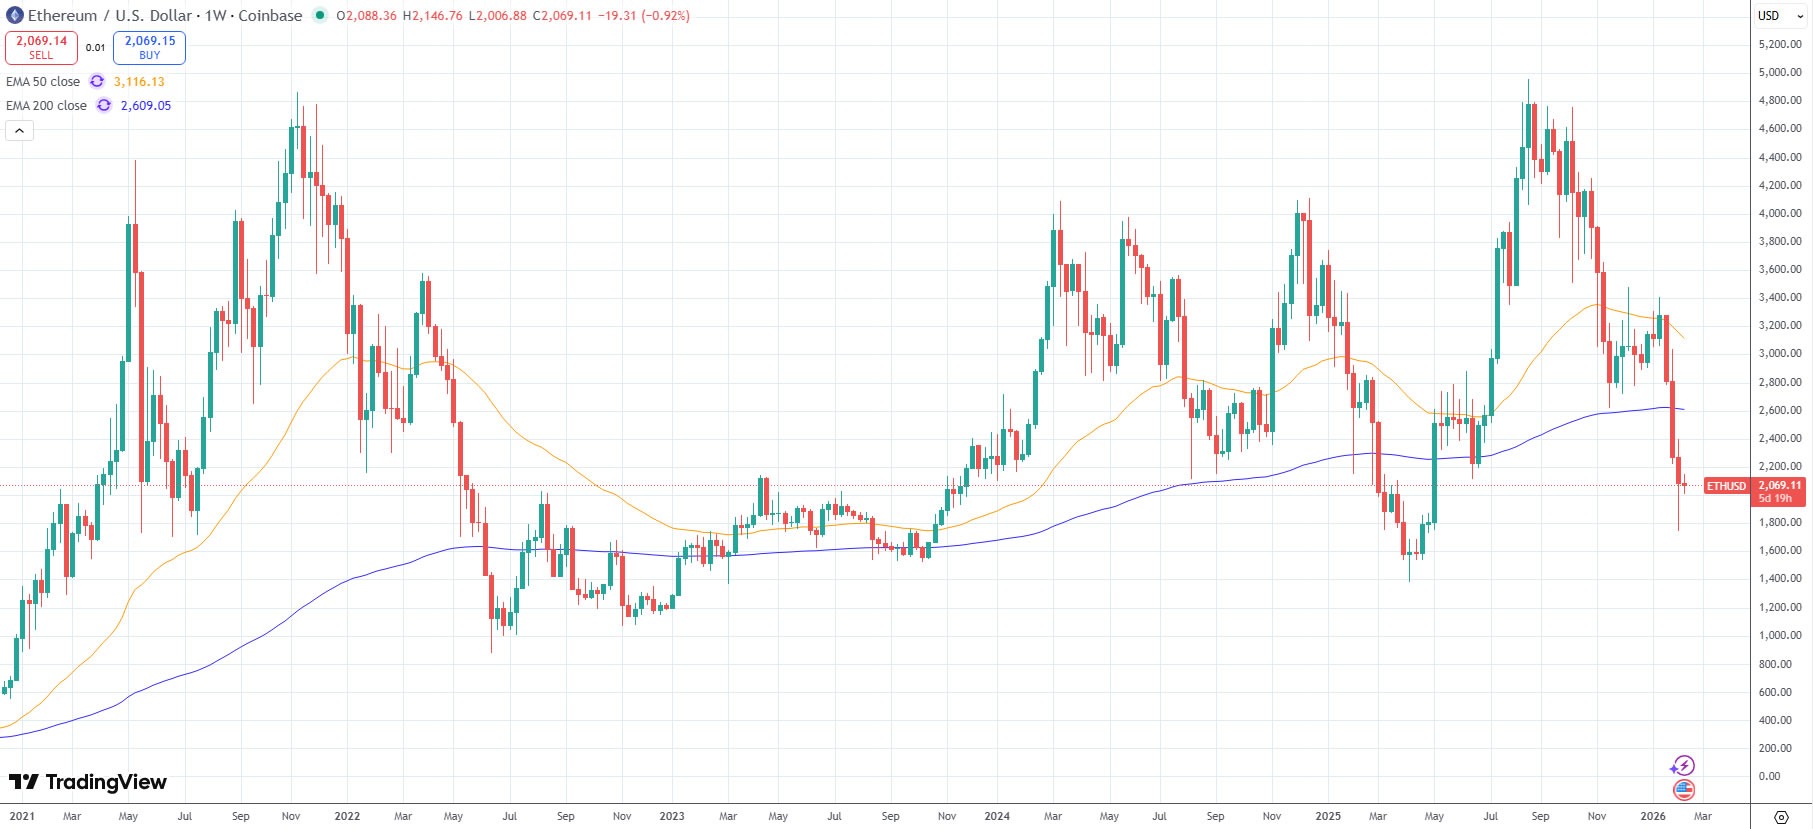
ETH prices have tanked back to long-term cycle lows. Source: TradingView
ETH Technical Support and Resistance Levels
- Supports: S1: 1.994$ (Strong, 0.86% away, Fibo 0.114 & RSI oversold based)
- S2: 1.747$ (Strong, 13.13% away, Donchian)
- Resistances: R1: 2.147$ (Strong, 6.75% away)
- R2: 2.575$ (28% away, Ichimoku)
Supertrend bearish, downtrend continues above EMA 20: 2.409$. RSI oversold indicates recovery potential, check ETH futures for details.
Ethereum ETF Flows Give Positive Signal
According to February 9, 2026 data, Ethereum ETFs recorded 57 million dollars in net inflows, while Bitcoin ETFs were supported with 144.9 million dollars. These flows indicate strong institutional demand despite MVRV capitulation and could accelerate bottom formation.
Analyst Views: Buying Opportunity?
Experts state that current levels are creating buying opportunities similar to past cycles. Despite tax season risks, fundamental indicators remain solid; follow closely.