Ethereum Holders Accumulate Amid Selling Pressure, Support at $2.7K in Sight
ETH/USDT
$31,047,650,067.90
$2,386.02 / $2,174.06
Change: $211.96 (9.75%)
-0.0008%
Shorts pay

Contents
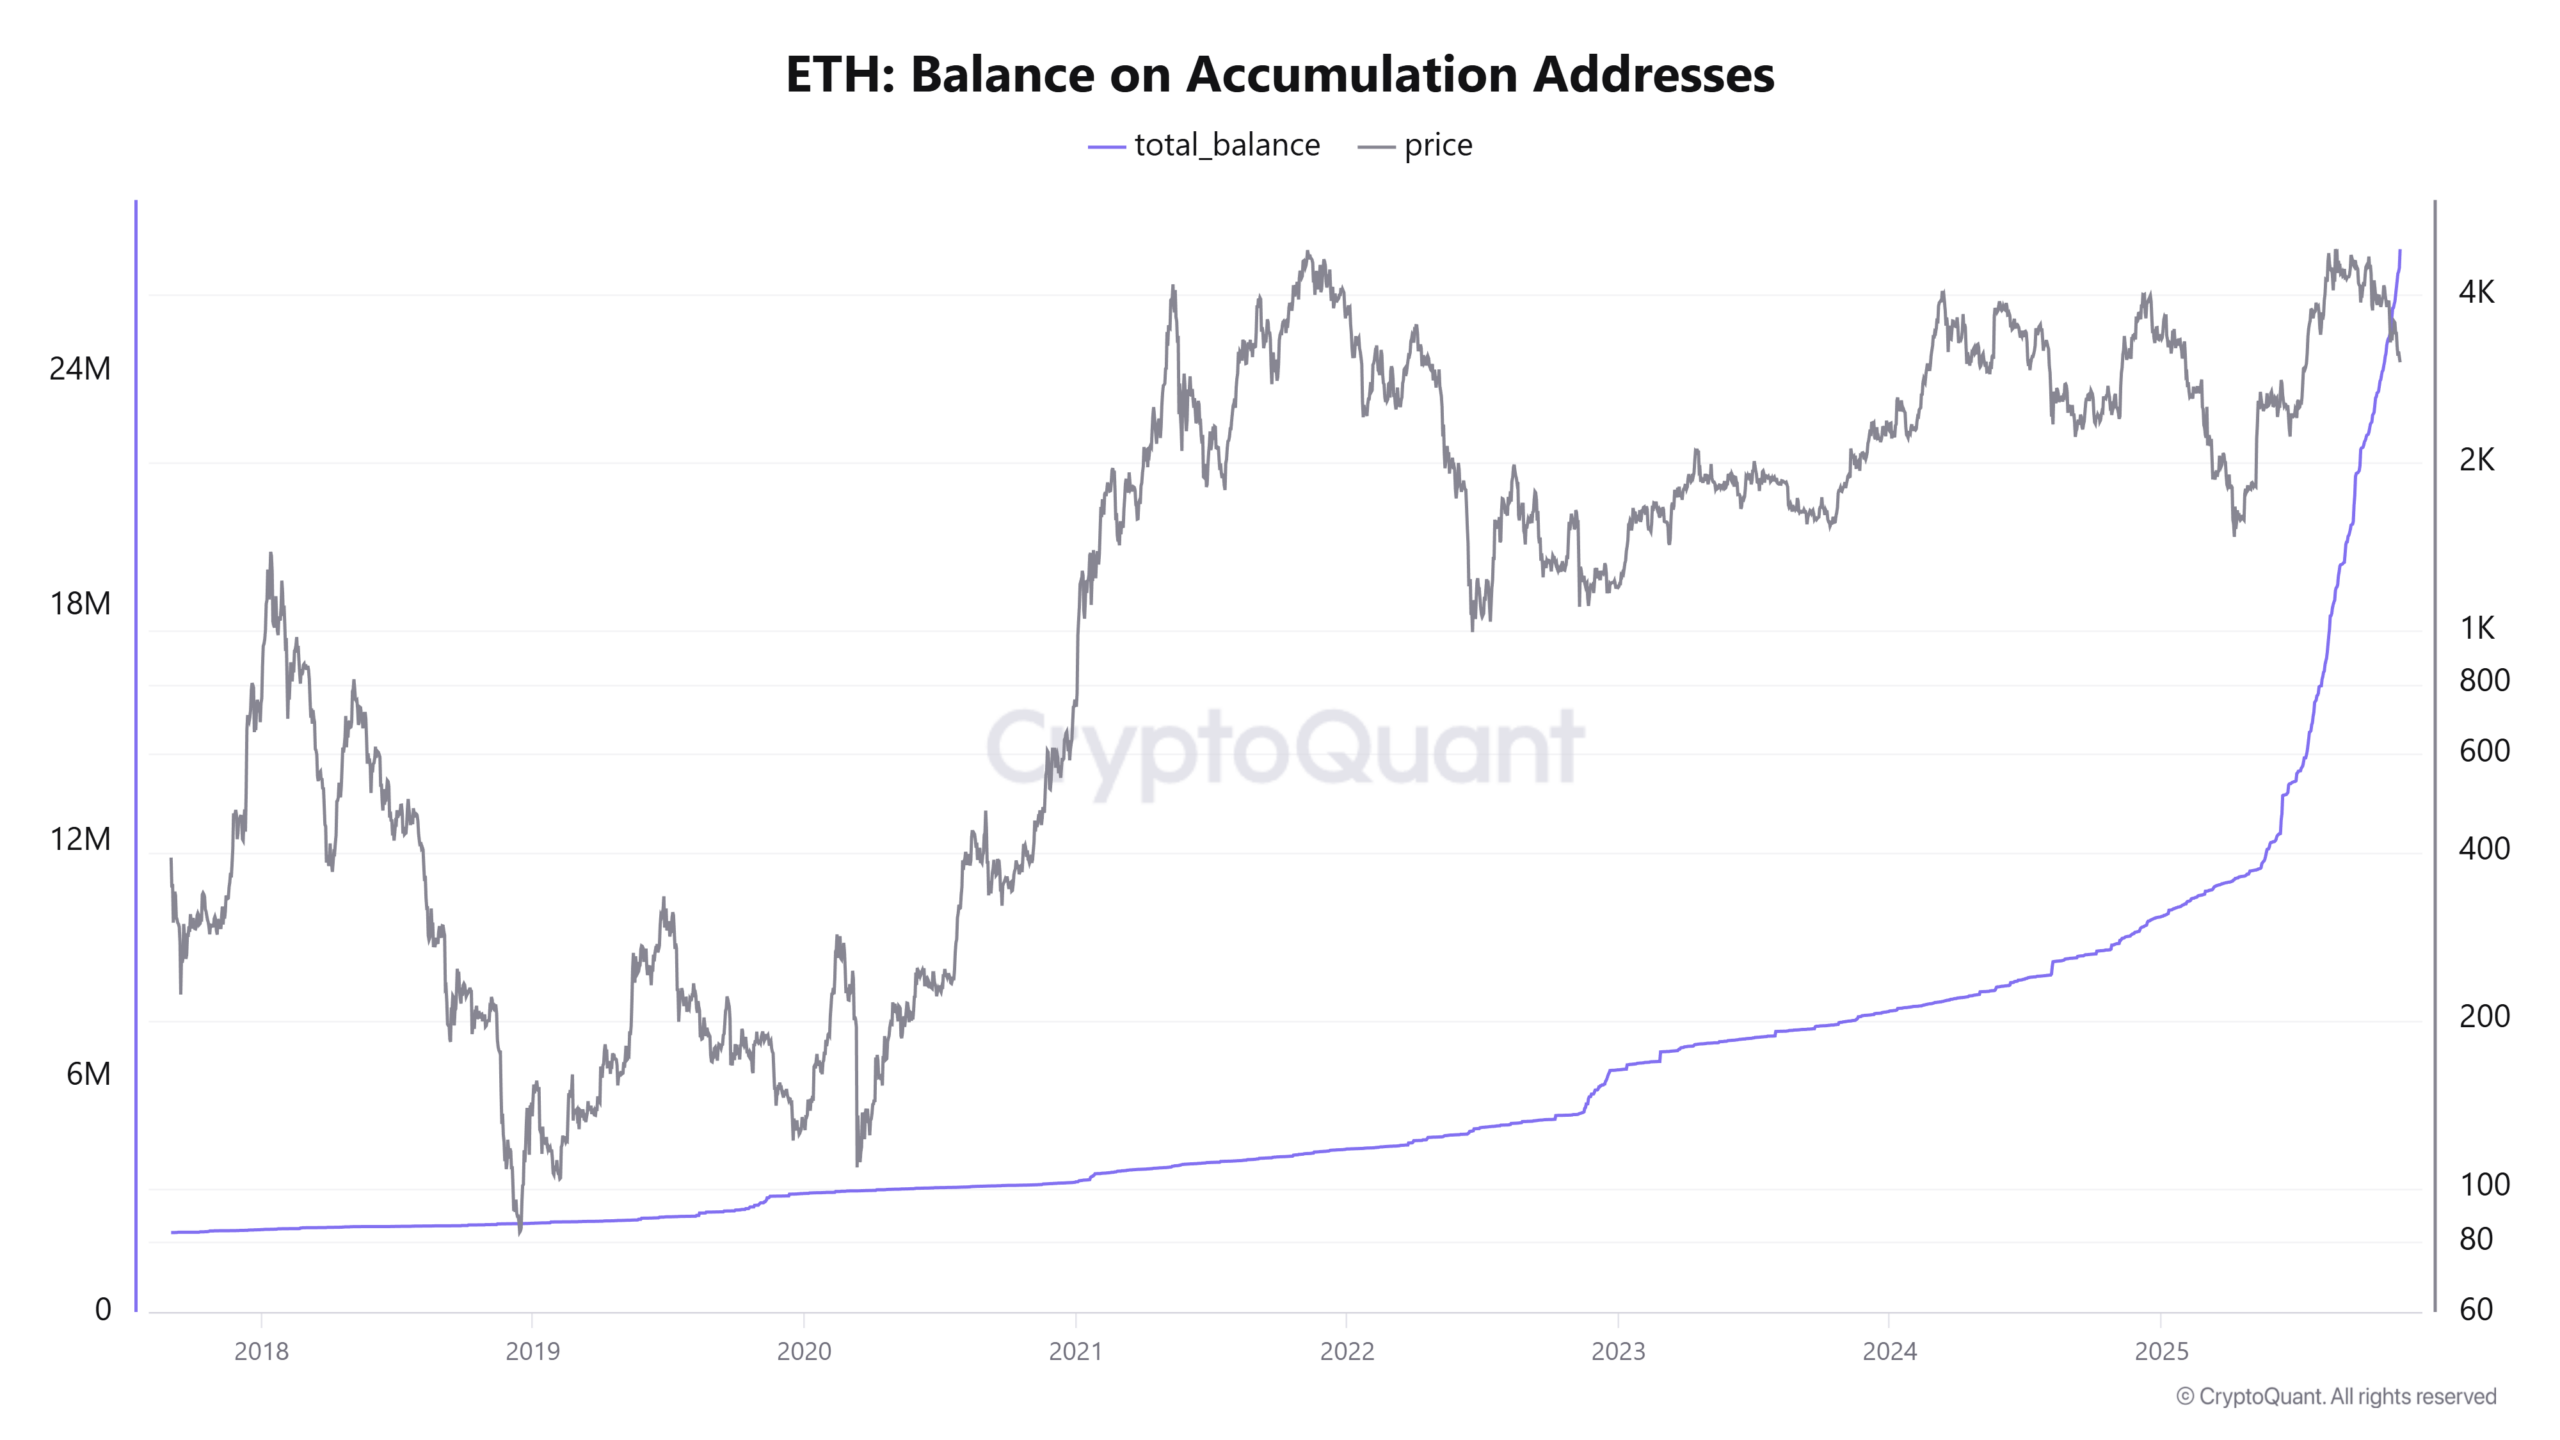
Ethereum accumulation addresses have steadily increased their ETH holdings despite the recent price drop to $2,956, reaching a realized price of $2,880. This ongoing accumulation by institutions signals potential support amid market pessimism, with key levels between $2,300 and $2,900 offering psychological barriers against further declines.
-
Ethereum’s price bounced 5.4% to $3,200 after hitting $2,956, but sentiment remains bearish with the Crypto Fear and Greed Index at 15.
-
Accumulation addresses and institutional digital asset transfers show continued buying, countering dominant selling pressure.
-
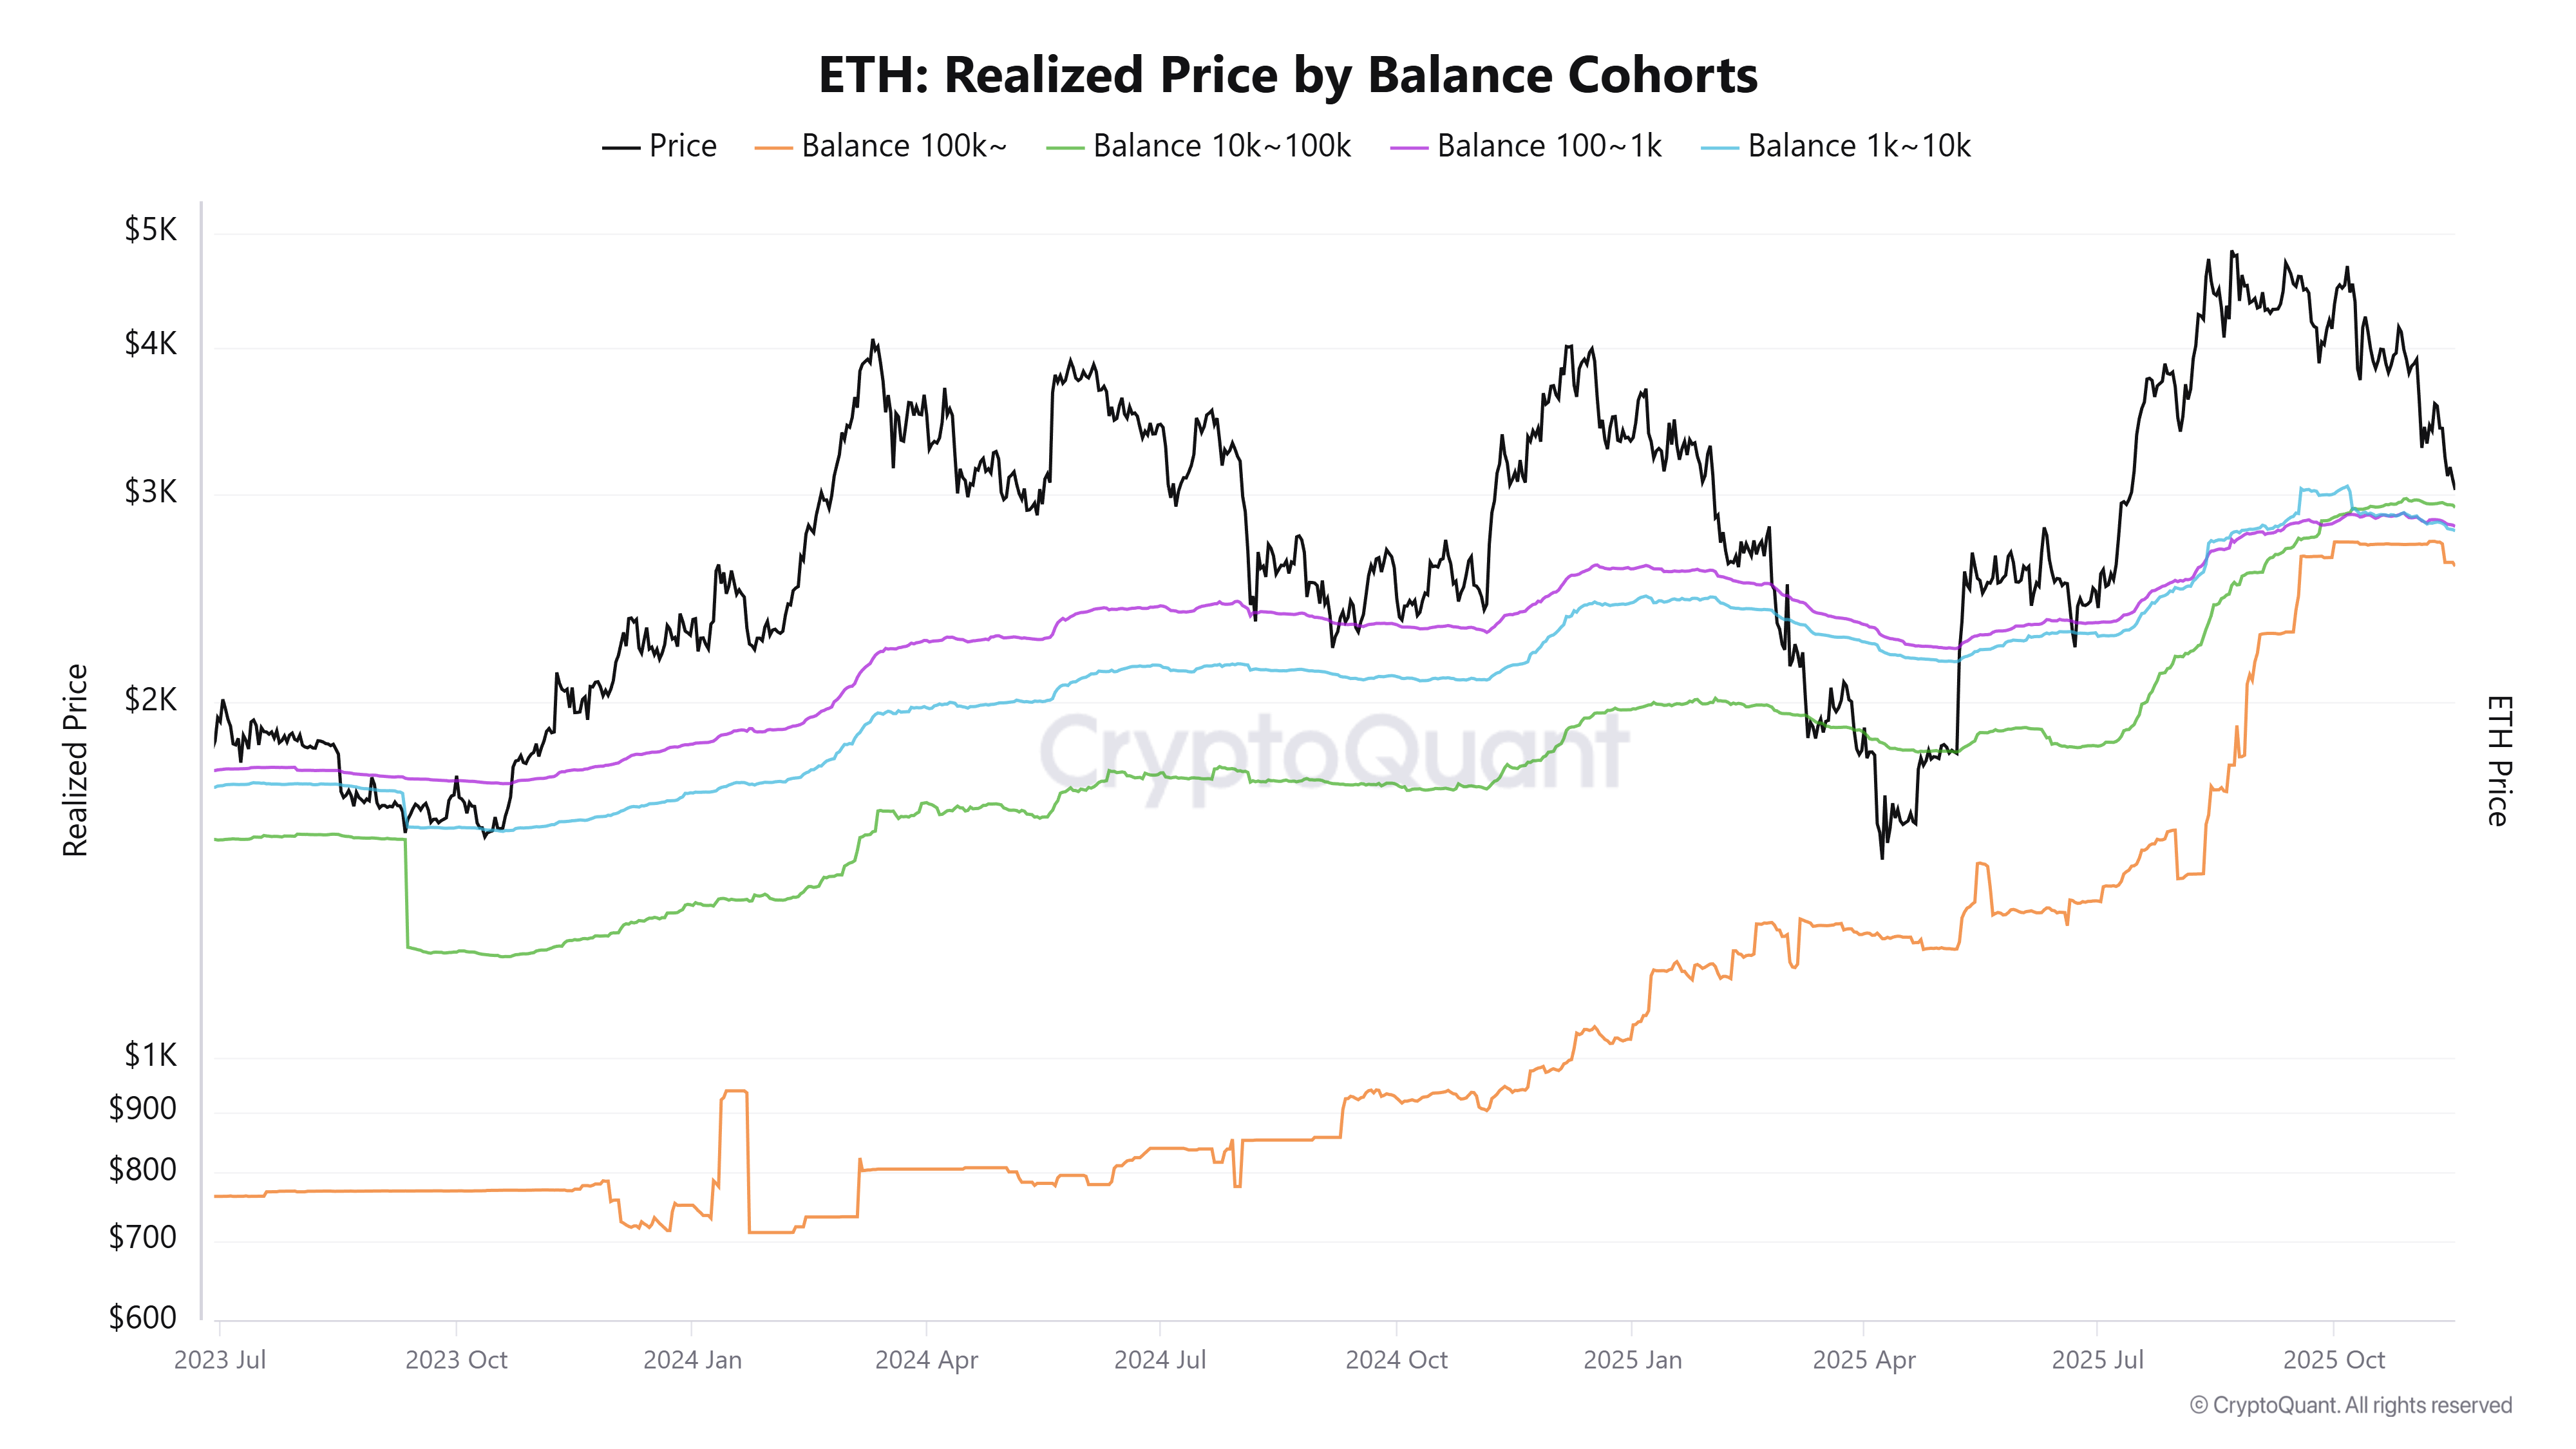
Realized price cohorts cluster between $2,600 and $2,920, providing critical support levels based on historical data from CryptoQuant analysis.
Ethereum accumulation persists amid price volatility: Explore key support levels and institutional buying signals for ETH’s next moves. Stay informed on crypto trends to make strategic decisions today.
What are Ethereum accumulation addresses telling us about the current market?
Ethereum accumulation addresses are entities that consistently buy and hold ETH over time, often indicating long-term confidence. Despite the recent dip to $2,956 on November 18, these addresses have grown their balances, reaching a realized price of $2,880 at the time of analysis. This trend suggests that select investors view the current levels as attractive entry points, even as broader market sentiment stays negative with the Crypto Fear and Greed Index registering 15.
How do realized price levels influence Ethereum’s price trends?
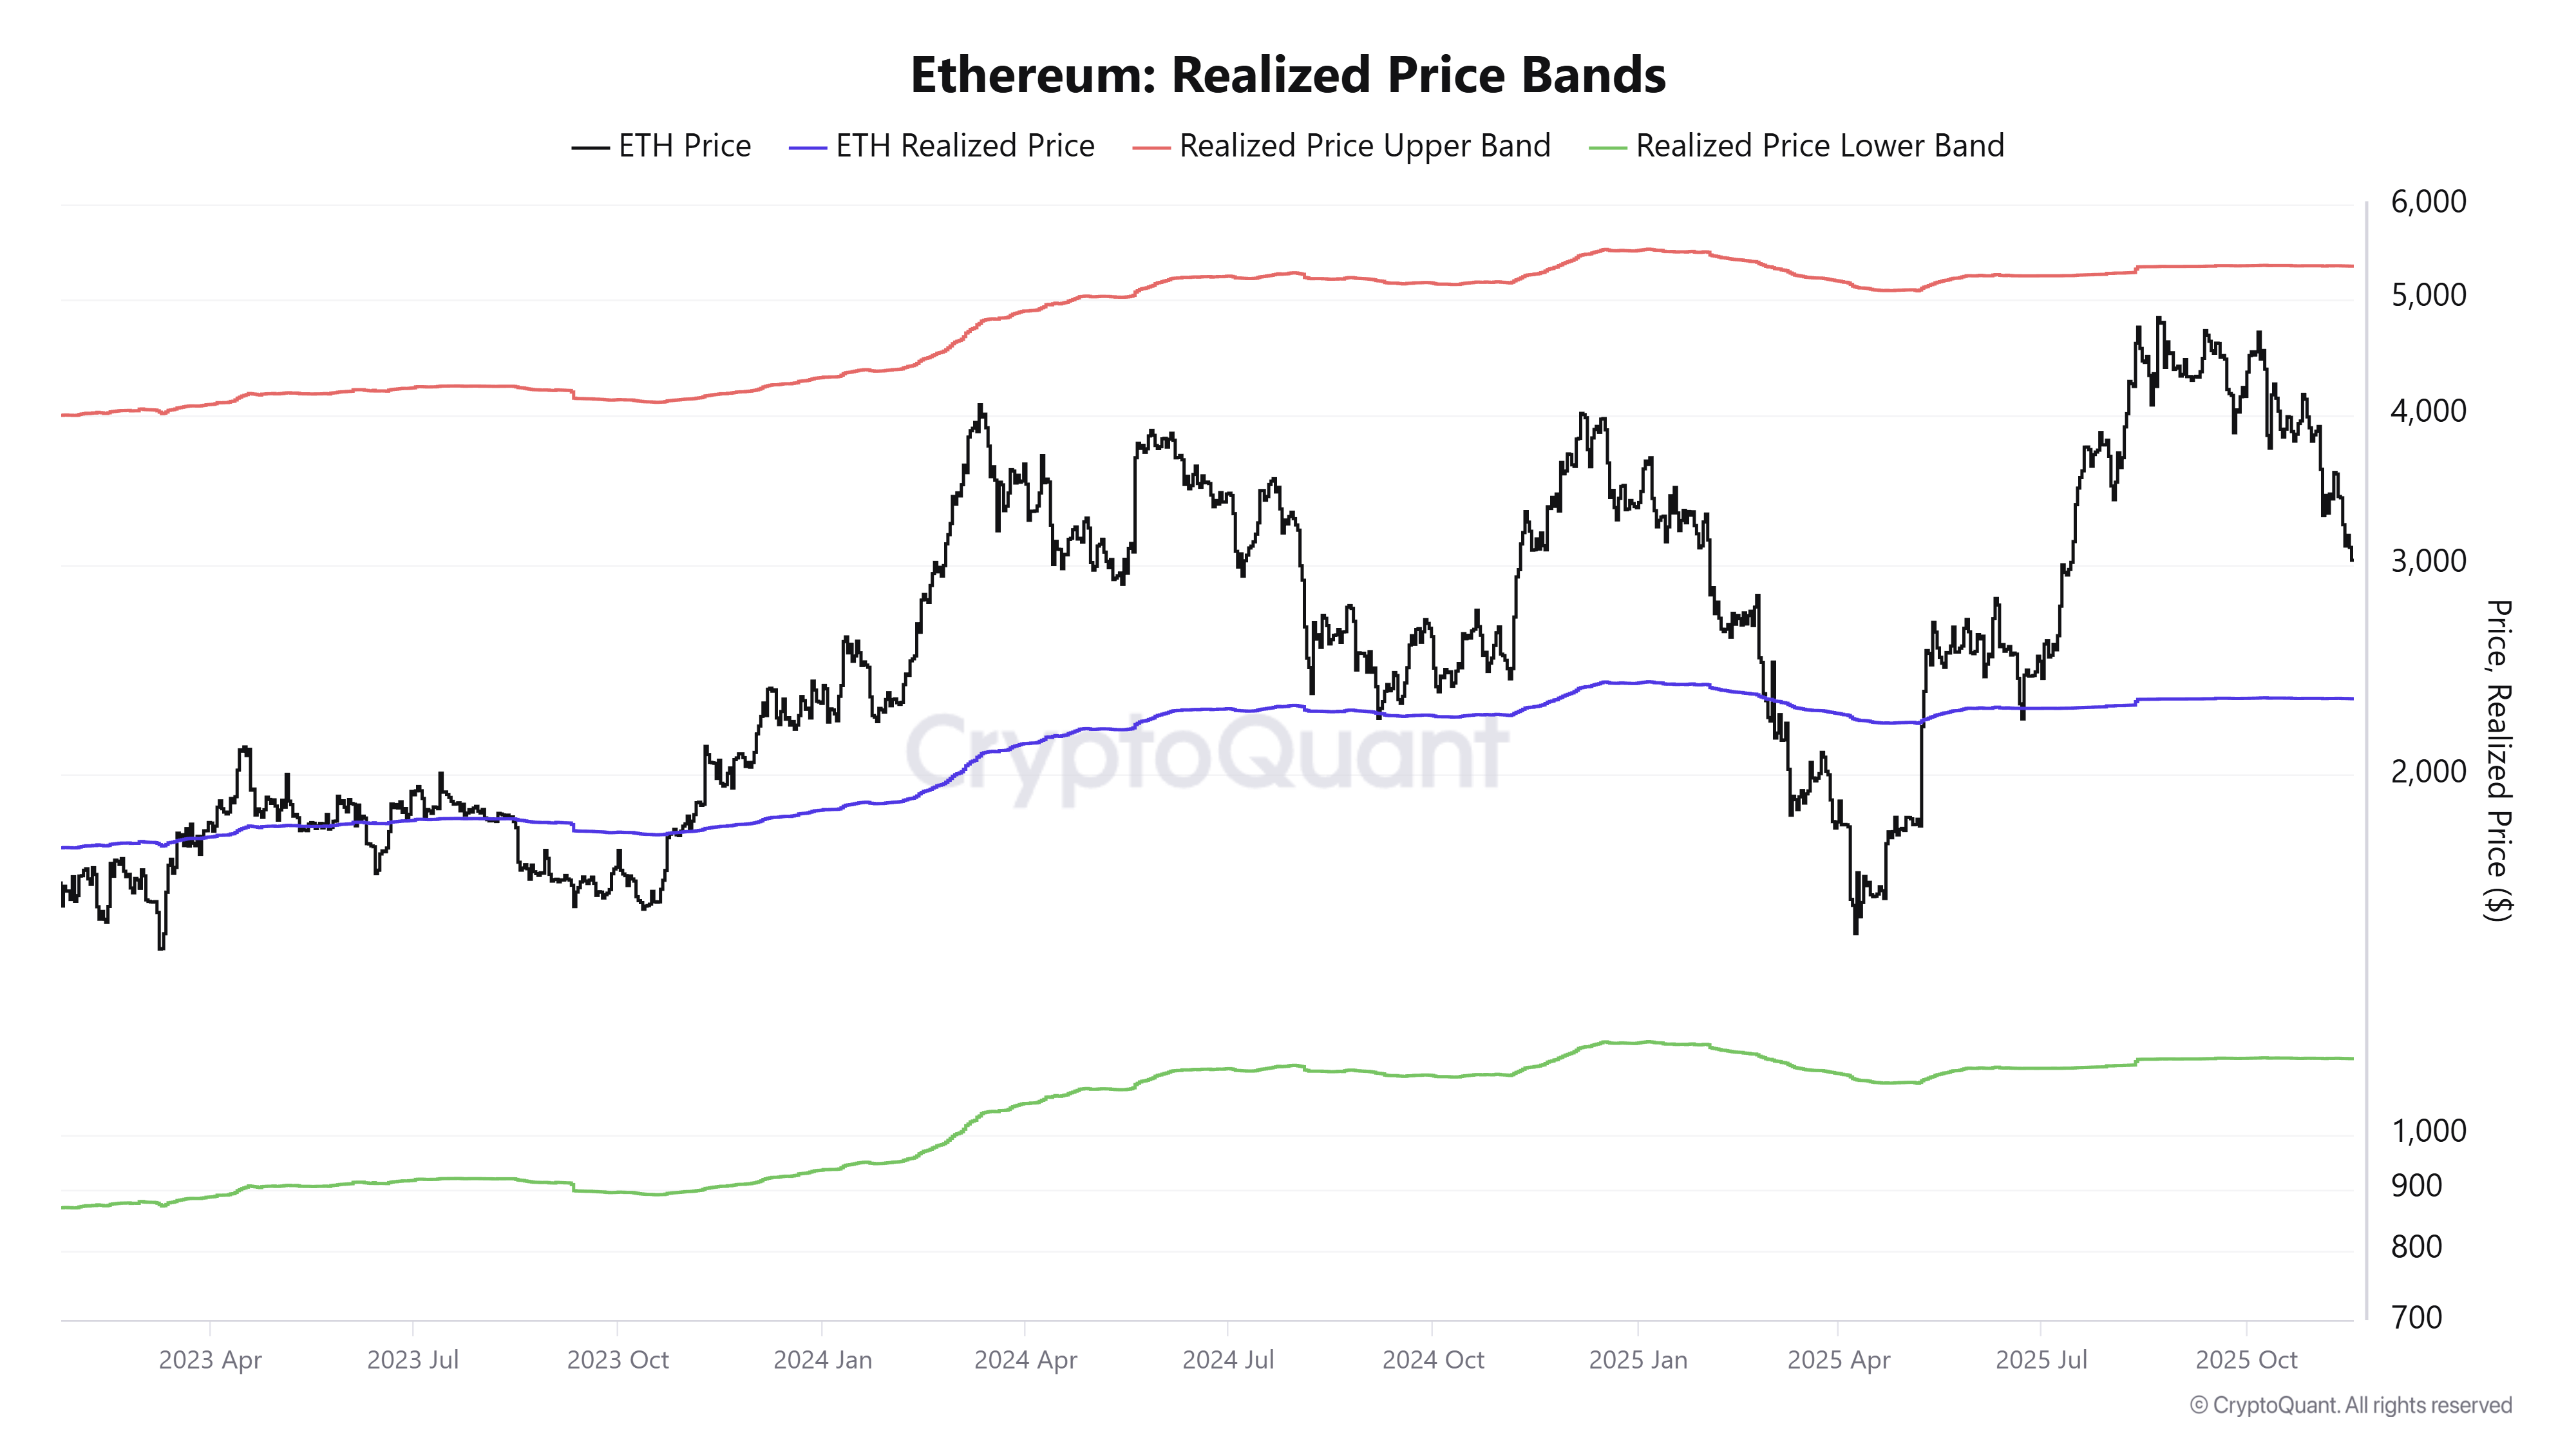
Realized price levels represent the average cost basis for different holder cohorts, serving as technical and psychological anchors that can dictate future movements. For Ethereum, the overall market realized price stands at $2,316, while larger holders (over 100k ETH) sit at $2,600, and mid-tier cohorts range from $2,790 to $2,920. Data from CryptoQuant highlights that during past corrections, such as April’s drop to $1,473, prices tested but often respected these levels. Expert analysts note that breaking below them could accelerate declines, but sustained accumulation above them bolsters reversal potential. Short-term, the 14-day exchange netflow remains negative, reinforcing reduced selling pressure from these groups. In historical contexts, these metrics have proven reliable for identifying support, though not absolute, urging traders to monitor volume and on-balance volume indicators for confirmation.
Source: CryptoQuant
The persistence of this accumulation amid widespread pessimism underscores a divergence between retail selling and institutional resolve. As Bitcoin reclaimed $90,000, Ethereum’s 5.4% rebound to $3,200 offers temporary relief, yet the daily chart reveals a bearish pattern of lower highs and lows since September. On-balance volume has trended downward, particularly post the October crash, indicating sustained distribution. However, negative exchange inflows over the past 14 days point to holders retaining assets rather than liquidating, a positive undercurrent for price stabilization.
Source: CryptoQuant
Weekly charts suggest a possible retracement to $2,700, aligning with the 78.6% Fibonacci level. These realized prices help delineate support zones: from accumulation addresses at $2,880 down to broader market cohorts around $2,316. Historical precedents, like the April low of $1,473 below realized prices, demonstrate that while these levels often hold, breaches can lead to deeper corrections. Financial experts emphasize preparing risk management strategies, as Ethereum’s trajectory hinges on whether accumulation outweighs selling in the coming weeks.
Frequently Asked Questions
Why are Ethereum accumulation addresses increasing despite the price drop?
Ethereum accumulation addresses are growing their holdings because institutional investors see the current dip to $2,956 as a buying opportunity, based on on-chain data showing steady inflows. This behavior counters retail selling, with balances rising amid negative exchange netflows, indicating confidence in long-term value. CryptoQuant reports confirm this trend has persisted for weeks, potentially stabilizing prices above key supports.
What happens if Ethereum breaks below its realized price levels?
If Ethereum falls below realized price levels like $2,316, it could trigger accelerated selling and test lower supports around $1,473, as seen in past cycles. This breach would signal weakened holder conviction, but ongoing accumulation might mitigate the impact. Monitoring institutional digital asset transfers provides real-time insights into market resilience during such events.
Source: CryptoQuant
Traders should watch the $2,521 level from May-July price action, alongside the $2,900 to $2,300 band. The on-balance volume’s decline post-October reinforces caution, but accumulation offers hope for reversal if Bitcoin’s momentum sustains.

Source: ETH/USDT on TradingView
Key Takeaways
- Ongoing Accumulation Signals Strength: Ethereum accumulation addresses have boosted holdings to a realized price of $2,880, defying selling pressure and hinting at institutional optimism.
- Critical Support Zones Identified: Realized prices for cohorts range from $2,600 to $2,920, with the market average at $2,316, offering reliable but not guaranteed floors based on historical patterns.
- Monitor Bearish Indicators: With a downtrend on daily charts and negative sentiment, watch $2,700 Fibonacci and $2,521 levels for potential reversal or further descent—adjust strategies accordingly.
Conclusion
In summary, Ethereum accumulation addresses demonstrate resilience amid the price descent to $2,956 and subsequent bounce to $3,200, while realized price levels from $2,300 to $2,900 serve as vital supports informed by CryptoQuant data. As institutional buying persists against retail pessimism, Ethereum’s path forward depends on breaking the bearish trend. Investors should track on-chain metrics and key thresholds closely, positioning for opportunities in this volatile landscape.