

Ethereum Lags Bitcoin 10% as DeFi TVL Sheds $43B and Bearish Pattern Forms
ETH/USDT
$3,879,096,482.24
$1,877.33 / $1,837.58
Change: $39.75 (2.16%)
+0.0056%
Longs pay

Ethereum News
Ethereum is showing pronounced relative weakness against Bitcoin as the second-largest cryptocurrency stalls near $2,140, lagging the broader market by roughly 10% over the past month. While Bitcoin has posted a 2% monthly gain, ETH has shed approximately 8%, widening the performance gap as traders question whether the network's softer fundamentals can support a recovery. The asset is consolidating below key resistance, with sliding holder cohorts and weakening on-chain demand reinforcing the view that recent price action represents structural fatigue rather than a routine pullback. Daily chart formations now point to continued downside risk if immediate support fails to hold.
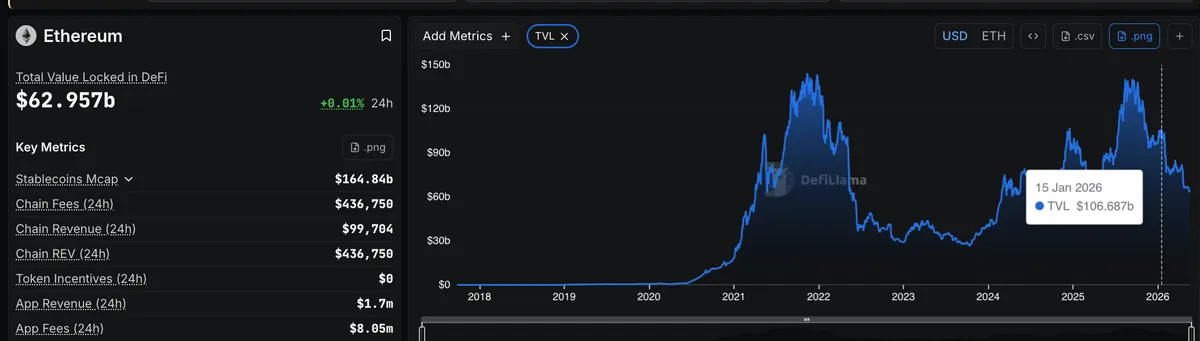
A sharp contraction in Ethereum's DeFi engine since January is emerging as a primary driver of price weakness. Total value locked across the network has fallen from $106.687 billion on January 15 to $62.957 billion as of May 18, a decline of nearly 41% in four months. The erosion accelerated in the late-March window that coincided with the start of the current bearish chart structure, with roughly $17 billion exiting protocols since TVL stood near $80.32 billion. The capital flight from lending, staking and yield products mirrors the descent on the price chart and explains much of ETH's underperformance versus BTC year-to-date.
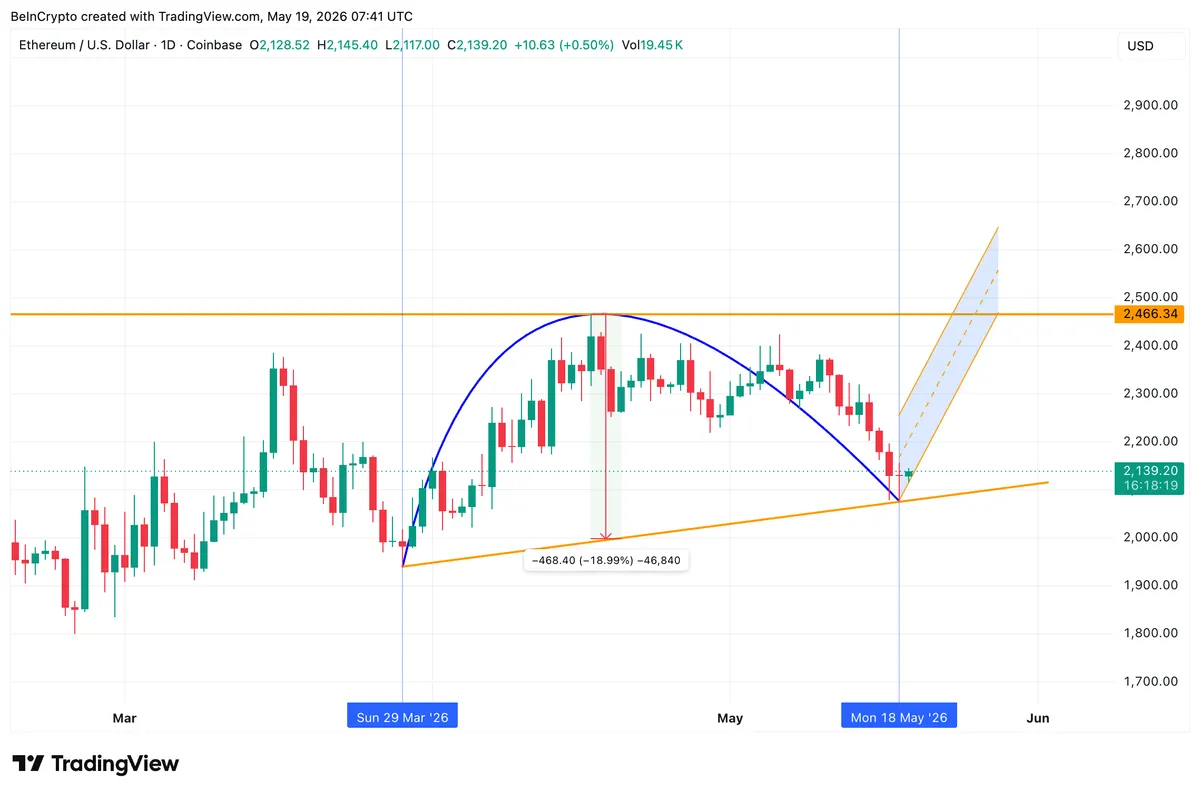
Technical analysts are flagging an inverted cup and handle formation carved out between March 29 and May 18 on the daily candlestick chart. The structure peaks in the middle of a rounded top before forming a brief recovery handle, a setup that historically signals continuation lower if the neckline breaks. The current rebound from sub-$2,100 levels increasingly resembles the handle portion rather than a sustained reversal, raising the probability of further downside acceleration. Traders are watching whether the formation completes its bearish target or whether bulls can defend immediate support and invalidate the pattern with a decisive close above the cup's neckline.
On-chain data reinforces the cautious narrative. The HODL Waves indicator, which tracks the share of supply held across different age cohorts, shows mid-term holders trimming positions during the recent slide. This cohort typically accumulates during consolidation phases and distributes near local tops, making their reduction in stake a notable behavioral shift. Combined with the broader DeFi stress, the rotation suggests that holders who weathered prior drawdowns are repositioning into cash or competing assets rather than averaging down. Until that cohort stabilizes or reverses course, near-term price recovery faces an additional structural headwind beyond chart-based weakness alone.
Broader market conditions remain unsupportive of an ETH recovery. Eighteen of the twenty largest tokens posted losses over the past 24 hours, with only SUI and NEAR managing modest gains. Market-wide futures notional volume climbed to $201 billion from $159 billion, while open interest held steady near $126 billion and liquidations dropped to $294 million from over $600 million a day earlier. The combination points to active repositioning rather than forced deleveraging, signaling a calmer but still defensive posture. The altcoin season index has slipped back to 33 out of 100, confirming capital is consolidating toward Bitcoin.
Macro positioning now hinges on whether Bitcoin can defend a key monthly closing level. Bitmine Chairman Tom Lee has identified the $76,000 threshold as the line that would confirm a continued bull market on a higher-timeframe basis. BTC was changing hands near $76,800 with the asset effectively hovering at that pivot, leaving Ethereum's near-term direction tied to the outcome. A Bitcoin close below the level would likely accelerate ETH's existing weakness and validate the bearish technical structure, while a successful defense could provide the catalyst needed for risk appetite to return across the altcoin complex and stabilize Ethereum's recent slide.
ETH is trading at $2,117 with the 24-hour decline of 1.22% extending the broader downtrend. Immediate support sits at $2,077, with deeper levels at $1,942 and $1,876 if selling pressure intensifies. Resistance begins at $2,131 and extends to $2,182 and $2,237. The RSI at 34.29 sits near oversold territory, suggesting limited downside acceleration risk in the very near term, though the bearish MACD signal confirms momentum remains weak. A daily close above $2,131 would invalidate the inverted cup thesis; a break below $2,077 likely opens the path toward $1,942.
COINOTAG does not provide financial advisory services. This content is for informational purposes only and should not be considered investment advice. Cryptocurrency investments involve high risk.
Add COINOTAG as a Preferred Source
Add COINOTAG to your preferred sources in Google News and Search to see our coverage first.
Add on GoogleRelated Tags
AI-generated, AI-reviewed, under COINOTAG editorial oversight.