Ethereum Nears Critical $2,930 Support, Hinting at Potential Downside Risks
ETH/USDT
$6,206,664,490.61
$2,046.60 / $1,979.99
Change: $66.61 (3.36%)
-0.0003%
Shorts pay

Contents
Ethereum is currently testing a critical monthly support level at around $2,930, a historic pivot that has influenced price action across multiple market cycles. Analysts indicate that holding above this zone could stabilize the market, while a break below may expose deeper supports near $2,000.
-
Ethereum’s price is hovering near the $2,930 monthly pivot, a level that has acted as both support and resistance in past cycles.
-
Recent rejections from higher ranges, around $3,200, highlight Ethereum’s range-bound trading pattern amid ongoing volatility.
-
Market data shows monthly closing prices as the key indicator, with current fear levels elevated according to sentiment indexes.
Ethereum support levels at $2,930 are under scrutiny as price tests historic pivots. Discover key analysis, risks, and potential outcomes for ETH traders in this in-depth 2025 update.
What Are the Key Ethereum Support Levels in the Current Market Cycle?
Ethereum support levels are pivotal in assessing the cryptocurrency’s near-term trajectory, particularly as it navigates a corrective phase below $3,000. The primary support zone sits at $2,930, a monthly pivot that has historically guided price behavior during various market conditions. This level, drawn from multi-year charts, represents a confluence of prior lows and moving averages, providing a structural floor that traders watch closely for signs of resilience or breakdown.
Supporting this are intermediate zones between $2,850 and $2,900, where consolidation has occurred in recent sessions. Ethereum’s position at these supports follows a series of failed attempts to sustain gains above $3,200, reinforcing a broader range-bound structure rather than an immediate bullish reversal. Analysts emphasize that the monthly close will determine whether this support holds, influencing exposure to lower levels like $2,000 if breached.
How Does Ethereum’s Monthly Pivot at $2,930 Influence Price Action?
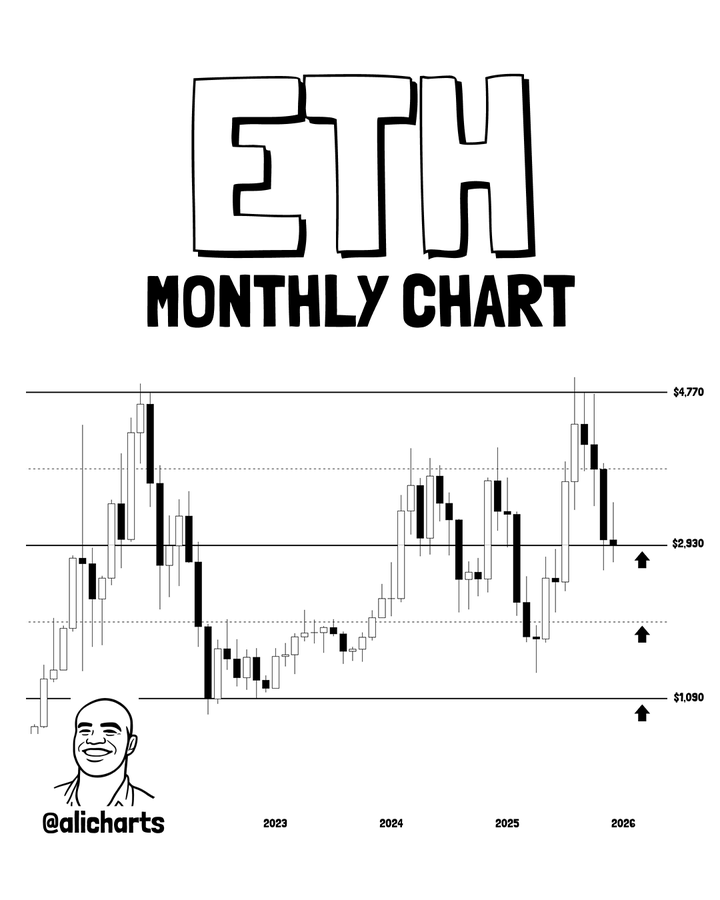
The $2,930 level serves as Ethereum’s monthly pivot, a technical benchmark calculated from prior period highs, lows, and closes that has alternated between support and resistance across several cycles. According to analysis from Ali Charts, this zone has consistently influenced price swings, with rejections from upper ranges leading to retracements into lower demand areas. Current price interaction at this pivot reflects broader structural dynamics, where the monthly candle’s rejection from higher grounds underscores limited upside momentum without stronger buying pressure.
Historical data illustrates this pattern: approaches to resistance near $4,770 have triggered supply responses, followed by declines back to supports like $2,930. If Ethereum accepts prices below $2,930, it could open the path to $2,000, a psychological level backed by prior cycle lows. Below that, $1,100 emerges as the deepest structural support, though such a move would signal significant downside risk. Trading volume during recent declines has been elevated, confirming seller conviction and aligning with distribution patterns observed in corrective phases.
Source: X
Expert insights from market technicians highlight that this pivot’s role extends beyond short-term noise, as it encapsulates higher timeframe trends. For instance, sustained defense at $2,930 could foster a rebound toward $3,000, but overhead supply from failed resistance tests remains a barrier. Ethereum’s alignment below key moving averages further supports a cautious outlook, where rallies may cap as corrective unless volume shifts decisively.
Frequently Asked Questions
What Happens if Ethereum Breaks Below the $2,930 Support Level?
If Ethereum breaks below the $2,930 support, it would likely accelerate downside momentum toward the next major zone at $2,000, a psychological level reinforced by historical lows. This breach could heighten market fear, prompting further de-risking among investors, though it might also attract value buyers if fundamentals remain intact. Traders should monitor volume for confirmation, as false breakdowns have occurred in past cycles.
Is Ethereum’s Current Price Action Indicative of a Larger Trend Reversal?
Ethereum’s current price action, trading below the 50-day and 200-day moving averages, suggests ongoing corrective bias rather than an immediate trend reversal. Sentiment indicators show elevated fear, which often precedes volatility but requires a monthly close above $3,000 for bullish confirmation. This natural progression aligns with how voice assistants might explain it: Ethereum needs sustained higher closes to shift from range-bound trading to an uptrend.
Key Takeaways
- Historic Pivot at $2,930: This level has guided Ethereum’s price across cycles, acting as a critical test for current support.
- Range-Bound Structure: Rejections from $3,200 and $4,770 resistance reinforce corrective patterns, with volume signaling seller strength.
- Monthly Close Matters: Focus on end-of-period pricing to gauge downside risks toward $2,000 or potential rebounds.
Conclusion
Ethereum support levels, particularly the $2,930 monthly pivot, are under intense scrutiny as the asset navigates a corrective phase amid broader market caution. With sentiment reflecting elevated fear and technical indicators pointing to restrictive trends, holding this zone could pave the way for stabilization, while a breakdown exposes deeper vulnerabilities. As 2025 progresses, investors are advised to prioritize higher timeframe signals for informed positioning, staying attuned to evolving price structures for opportunities in this dynamic cryptocurrency landscape.
Comments
Other Articles
Vitalik Buterin: The AI Revolution in DAO Management
February 23, 2026 at 02:58 PM UTC
BitMine Boosts Ethereum Stake to 461K ETH, Eyes Network Share Growth
January 1, 2026 at 08:06 PM UTC
Ethereum Inflow to Binance Surges to 24,500 ETH, Hinting at Short-Term Bearish Pressure
January 1, 2026 at 05:00 PM UTC