Ethereum Price Faces Further Decline Toward $3,400 After Support Break
ETH/USDT
$15,764,184,570.61
$1,937.17 / $1,835.36
Change: $101.81 (5.55%)
-0.0004%
Shorts pay

Contents
Ethereum price today stands at $3,498, reflecting a 0.81% decline over the last 24 hours according to CoinStats. The cryptocurrency has broken below key support at $3,532 on the hourly chart, signaling potential further correction toward $3,400 amid broader market shifts to red.
-
ETH/USD Rate Drop: Ethereum’s value has decreased by 0.81% in the past day, trading at $3,498 as of the latest update.
-
On hourly charts, ETH breached local support at $3,532, with a close below this level likely extending the downturn.
-
Longer-term analysis shows a rebound from $3,654 resistance, but midterm indicators suggest limited volatility near current supports and resistances.
Ethereum price analysis reveals a 0.81% drop to $3,498 today. Explore key supports, resistance levels, and market trends for informed trading decisions. Stay updated on ETH’s path forward.
What Is the Current Ethereum Price?
Ethereum price is currently at $3,498, marking a 0.81% decline over the last 24 hours based on data from CoinStats. This movement follows a break below the local support level of $3,532 on the hourly chart, indicating ongoing correction pressures. If the daily candle closes near or under $3,532, Ethereum could test the $3,400 zone in the near term, as observed in recent TradingView charts.
The market is changing to red, according to CoinStats.
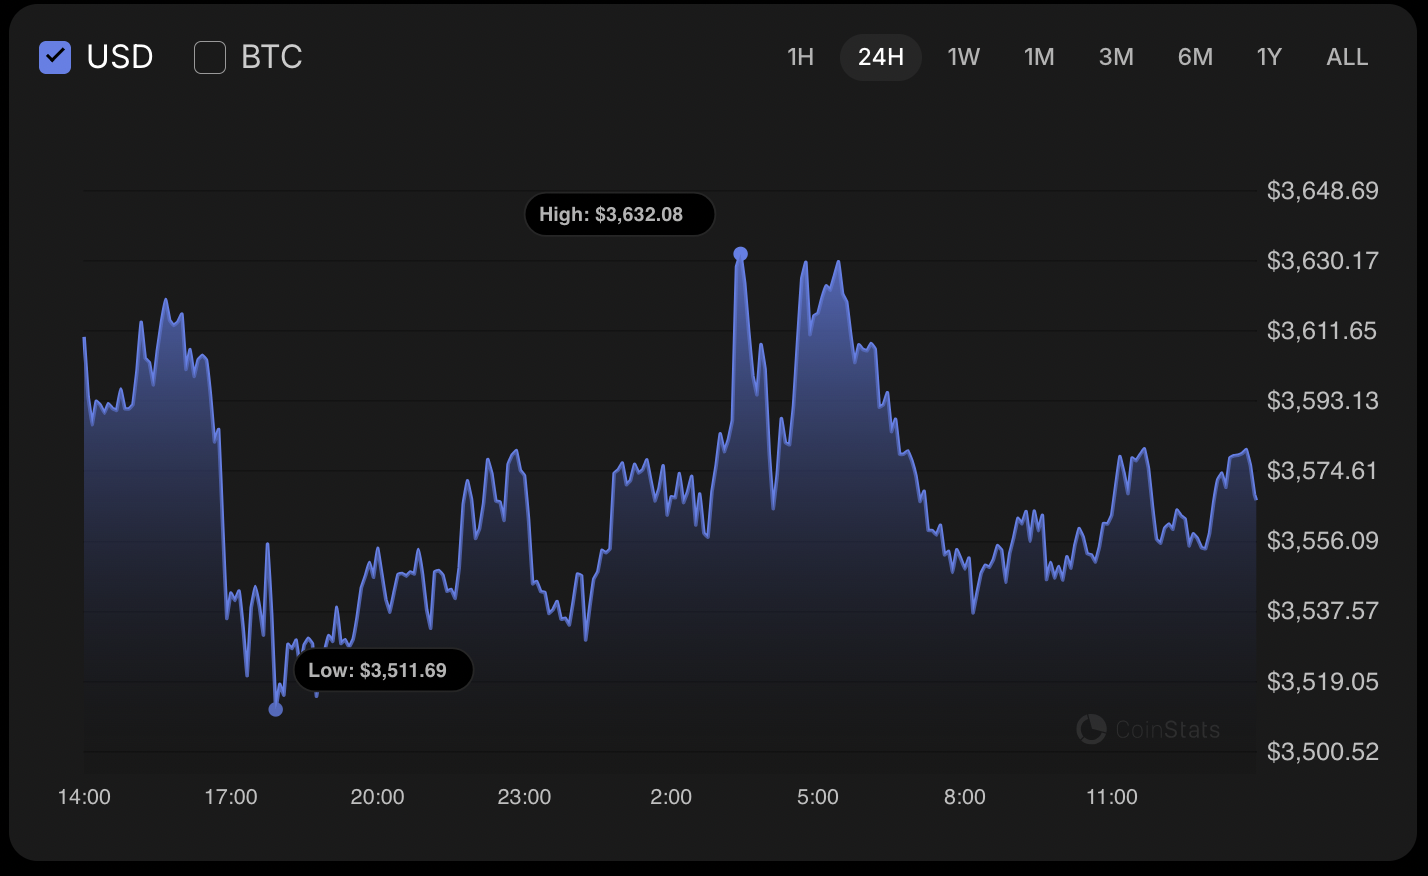
ETH chart by CoinStats
Why Is Ethereum Price Declining Today?
Ethereum’s price decline today stems from broader market sentiment turning bearish, with the cryptocurrency failing to hold above the $3,532 support on shorter time frames. According to TradingView analysis, the hourly chart shows a clear downward trajectory after this breach, potentially driven by increased selling pressure in the altcoin sector. Data from CoinStats confirms the 0.81% drop, aligning with reduced trading volume and resistance at higher levels like $3,654.
In the longer time frame, Ethereum has bounced off the $3,654 resistance once more, but without strong bullish catalysts, the price remains vulnerable. Expert analysts from financial platforms note that such corrections often follow periods of consolidation, with historical data showing ETH recovering from similar dips when global market conditions stabilize. For instance, in recent months, Ethereum has demonstrated resilience by maintaining key supports during volatile sessions, though current indicators point to a measured descent rather than a sharp reversal.
TradingView charts illustrate this pattern vividly: the breach of $3,532 support on the hourly view suggests sellers are in control, while the daily perspective highlights the resistance barrier at $3,654 limiting upside potential. If the situation persists without intervention from macroeconomic factors, traders may anticipate a continued slide toward the $3,400 support zone in the short term. This level has historically acted as a strong floor, absorbing previous declines and paving the way for rebounds, as evidenced by past price action data.

Image by TradingView
On the hourly chart, the price of ETH is going down after breaking the local support of $3,532. If the daily bar closes near that mark or below it, the correction is likely to continue to the $3,400 zone.

Image by TradingView
From a midterm perspective, no immediate reversal signals are present, with Ethereum’s price positioned away from major support and resistance zones. This positioning reduces the likelihood of sharp price swings by week’s end, allowing for a more gradual adjustment. CoinStats data underscores the stability in this range, where ETH has traded without extreme volatility, reflecting mature market behavior in the face of routine fluctuations.
Overall, Ethereum’s ecosystem continues to underpin its value, with ongoing developments in layer-2 scaling solutions and smart contract adoption providing long-term confidence. However, short-term traders should monitor volume indicators closely, as sustained low activity could prolong the current downtrend until external buying interest emerges.
Frequently Asked Questions
What Is the Ethereum Price Prediction for the Next Week?
The Ethereum price prediction for the next week points to potential testing of the $3,400 support if the current decline persists below $3,532, based on TradingView technical patterns. Analysts expect limited upside without a break above $3,654 resistance, with the asset likely consolidating around $3,400-$3,500 amid subdued market momentum, according to CoinStats updates.
How Does Ethereum’s Price Compare to Recent Trends?
Ethereum’s price has followed a corrective path similar to recent altcoin trends, dropping 0.81% today after rejecting higher resistances, much like patterns seen in the past month. This natural pullback allows for healthier positioning, with voice search queries on platforms highlighting ETH’s role in decentralized finance as a stabilizing factor for future gains.

Image by TradingView
Key Takeaways
- Current ETH Price Level: Trading at $3,498 with a 0.81% daily decline, as reported by CoinStats, emphasizing the need for vigilance around support zones.
- Technical Support Breach: The hourly chart break below $3,532 signals further potential downside to $3,400, supported by TradingView’s resistance analysis at $3,654.
- Midterm Stability: No sharp reversals expected soon, offering traders a window to assess broader crypto market cues before positioning.
Conclusion
In summary, the Ethereum price analysis today highlights a measured decline to $3,498, influenced by key support breaks and resistance tests as detailed in TradingView and CoinStats data. While short-term pressures suggest a path toward $3,400, Ethereum’s robust fundamentals in blockchain innovation position it well for eventual recovery. Investors are encouraged to track upcoming market developments closely for optimal entry points into this leading cryptocurrency.
Ethereum is trading at $3,498 at press time.
Comments
Other Articles
Vitalik Buterin: The AI Revolution in DAO Management
February 23, 2026 at 02:58 PM UTC
BitMine Boosts Ethereum Stake to 461K ETH, Eyes Network Share Growth
January 1, 2026 at 08:06 PM UTC
Ethereum Inflow to Binance Surges to 24,500 ETH, Hinting at Short-Term Bearish Pressure
January 1, 2026 at 05:00 PM UTC