Ethereum Shows Potential Bull Pennant Formation as Price Recovers Near $3,000
ETH/USDT
$11,341,264,445.51
$2,157.00 / $2,050.12
Change: $106.88 (5.21%)
-0.0036%
Shorts pay

Contents
Ethereum is forming a macro bull pennant pattern on multi-year charts, signaling potential continuation of its upward trend after recovering from recent lows near $2,750. Treasury-linked firms also exhibit early bottoming signals, suggesting market stabilization amid ongoing volatility.
-
Ethereum maintains a multi-year bull pennant with rising support levels on two-month charts, indicating building bullish momentum.
-
Treasury-linked companies display local bottom formations after extended declines, marking a possible shift toward stabilization.
-
ETH currently trades around $3,028, up from November lows, with resistance at $3,250-$3,400 needing clearance for stronger recovery.
Ethereum bull pennant emerges on long-term charts as treasury firms signal bottoms, hinting at crypto market rebound. Explore key technical insights and price outlook for informed trading decisions today.
What is the Ethereum Bull Pennant Pattern?
Ethereum bull pennant refers to a technical chart formation that suggests a continuation of an existing uptrend after a period of consolidation. This pattern has developed over multiple years on Ethereum’s price charts, featuring converging trendlines that form after a significant rally from below $500 to highs near $4,800. It indicates building pressure for a potential breakout, with recent price action testing key boundaries and showing higher lows that reinforce structural support.
The bull pennant typically emerges following a strong upward move, where the asset pauses to consolidate gains in a symmetrical triangle shape. For Ethereum, this structure highlights the resilience of long-term buyers, as each retracement has respected rising support levels. As of late 2025, the pattern remains intact, positioning ETH for a decisive move once it breaks above the upper trendline.
How Are Treasury-Linked Firms Showing Bottoming Signals?
Treasury-linked firms associated with Ethereum operations are displaying early signs of local bottoms after prolonged downward trends. According to analysis shared by trader web3pulse on X, these companies’ charts reveal compact consolidation zones following extended declines, which often precede a transition from selling pressure to stabilization. For instance, BitMine’s recent dividend announcement has sparked renewed interest, potentially broadening investor appeal through yield opportunities and providing tentative support to Ethereum-related equities.
Supporting data from market observations indicates that these firms have exhausted much of their downside momentum, with price action forming higher lows in recent sessions. However, experts caution that true reversal confirmation requires sustained higher highs and increased volume. Bloomberg reports on corporate treasury strategies underscore how such developments in crypto-tied businesses could influence broader market sentiment, emphasizing the need for vigilant monitoring amid economic uncertainties. This setup aligns with Ethereum’s own technical resilience, suggesting interconnected recovery paths for the ecosystem.
In practical terms, these bottoming signals manifest as reduced volatility and tighter price ranges, allowing for accumulation without aggressive selling. Financial analysts from Reuters have noted similar patterns in past cycles, where treasury exposures to digital assets led to phased rebounds. For Ethereum stakeholders, this implies that positive corporate actions could amplify network adoption, driving demand for ETH as a foundational asset.
Frequently Asked Questions
What does a macro bull pennant mean for Ethereum’s long-term price?
A macro bull pennant on Ethereum’s charts signals a likely continuation of the prior uptrend after consolidation, potentially leading to significant gains if it breaks upward. Formed over years from $500 lows to $4,800 highs, it shows rising support and buyer control. Traders anticipate a breakout target based on the pattern’s pole length, but confirmation via volume is essential for reliability.
Are treasury-linked firms ready for a full recovery alongside Ethereum?
Treasury-linked firms tied to Ethereum are showing promising local bottoms with consolidation after declines, but they need volume spikes and higher highs for full recovery confirmation. Announcements like BitMine’s dividend highlight yield potential drawing investors, yet broader market factors must align. This could support Ethereum’s rebound if corporate stability strengthens ecosystem confidence.
Key Takeaways
- Ethereum’s bull pennant integrity: The multi-year pattern’s converging trendlines and higher lows indicate sustained bullish structure, preparing for a potential directional breakout.
- Early stabilization in firms: Treasury-linked companies exhibit exhaustion of selling after drops, with dividends boosting interest, though reversal needs further technical validation.
- Price action insights: ETH’s recovery to $3,028 from $2,750 lows suggests buyer resurgence; overcoming $3,250 resistance could signal a trend shift—monitor closely for entry points.
Conclusion
The Ethereum bull pennant pattern, combined with emerging bottom signals in treasury-linked firms, paints an encouraging picture for crypto market stabilization in late 2025. As Ethereum hovers near $3,028 and tests key resistances, these technical developments underscore a shift from downside pressure to potential accumulation. Investors should stay informed on chart confirmations and corporate updates to capitalize on upward momentum, positioning for what could be a renewed bullish phase in the digital asset space.
Ethereum shows renewed technical interest as long-range charts maintain a clear pennant pattern while related companies begin forming local bottoms. Market behavior signals stabilization after weeks of downside pressure and a shift toward early accumulation.
Ethereum Multi-Year Pennant Structure
Ethereum remains centered within a broad technical formation that has developed over several years. Trader Tardigrade shared a two-month chart showing a bull pennant supported by converging trendlines. This structure formed after a sharp rally from sub-$500 levels toward the $4,800 region.
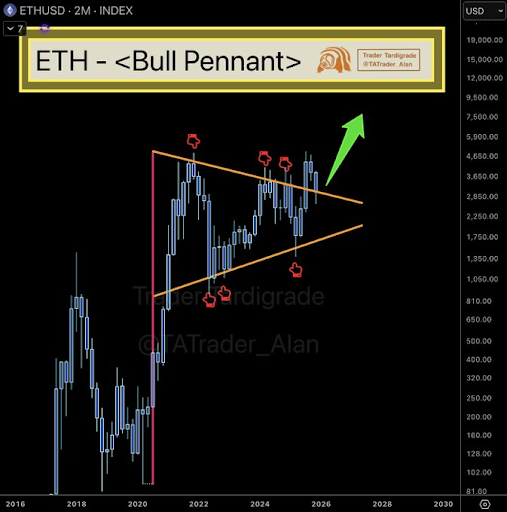
Source: X
The pattern held its form through repeated interactions with both boundaries. Each touch created a detailed map of market behavior, showing rising strength on every retracement. The lower trendline observed several decreases between 2022 and 2024 and created a continuous series of higher lows throughout the macrostructure.
The last candle has tested the upper line again above. Price closed back inside the continuation zone before moving upward again. Such retests often form decisive signals on wider timeframes. The compression near the apex suggests price is preparing for a directional move once a confirmed break arrives.
Local Bottom Signals in Related Companies
web3pulse shared that several treasury-linked companies tied to ethereum appear to have formed local bottoms. Their charts show extended declines followed by compact consolidation zones. This often marks a shift from heavy distribution toward early stabilization.
BitMine announced a dividend, creating fresh interest and drawing attention to its chart structure. Dividend actions often attract a wider pool of investors due to yield potential. This may offer some support to equities tied to ethereum operations, though technical confirmation remains necessary for broader momentum.
The post noted that these companies must show stronger progress before contributing to a sustained rally. Their current setups show early signs of selling exhaustion but not a full reversal. Until higher highs appear on their charts, the market continues to observe them with cautious optimism.
ETH Price Recovery and Near-Term Structure
Ethereum as of writing, trades near $3,028 after declining from about $4,124 earlier in the month. The chart shows a series of lower highs leading into mid-November, forming a controlled descent toward the $2,750 region. This area acted as support and triggered a steady rebound.
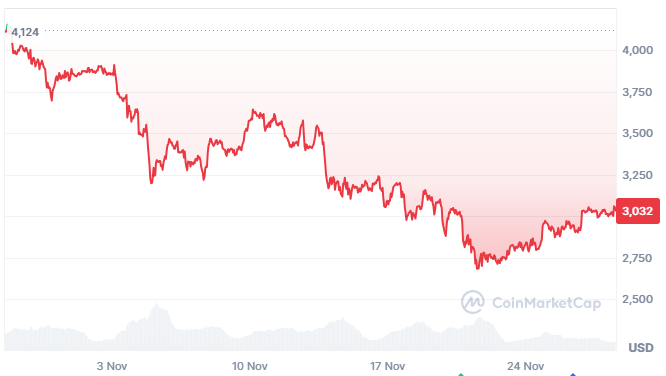
Source: coinmarketcap
The recovery shows moderate strength as the asset moves away from the monthly low. Price action has shifted from sharp downward movement to a more stable upward rhythm. This is an indication that buyers are coming back to the market and sellers are reducing their pressure.
To have a stronger trend change, ethereum would have to overcome the $3,250-3,400 resistance zone. These levels capped several attempts earlier in the month. Until those boundaries are cleared, the current move remains a controlled correction within a broader downtrend.
In the broader context, Ethereum’s technical setup aligns with historical patterns observed in major bull markets. Data from Chainalysis highlights increased institutional interest in ETH staking, which could underpin long-term price stability. As treasury firms stabilize, their balance sheet exposures to Ethereum may encourage further corporate adoption, per insights from Deloitte’s crypto reports. This interconnected dynamic positions the asset for measured growth, provided macroeconomic conditions remain supportive.
Market participants are closely watching on-chain metrics, such as transaction volumes and active addresses, which have ticked upward recently. According to Glassnode analytics, Ethereum’s network activity reflects renewed utility in DeFi and layer-2 solutions, bolstering the bull pennant’s validity. For traders, employing risk management strategies like stop-losses below the $2,750 support is advisable amid potential volatility.
Looking ahead, a confirmed pennant breakout could target projections based on the formation’s dimensions, potentially revisiting prior highs. Meanwhile, treasury-linked firms’ progress will serve as a barometer for sector health. Overall, these elements contribute to a cautiously optimistic outlook for Ethereum in the evolving crypto landscape.
Comments
Other Articles
Vitalik Buterin: The AI Revolution in DAO Management
February 23, 2026 at 02:58 PM UTC
BitMine Boosts Ethereum Stake to 461K ETH, Eyes Network Share Growth
January 1, 2026 at 08:06 PM UTC
Ethereum Inflow to Binance Surges to 24,500 ETH, Hinting at Short-Term Bearish Pressure
January 1, 2026 at 05:00 PM UTC