Ethereum Tests $2,620 Support Zone Amid Potential Wave 4 Setup and Whale Accumulation
ETH/USDT
$6,206,664,490.61
$2,046.60 / $1,979.99
Change: $66.61 (3.36%)
-0.0003%
Shorts pay

Contents
Ethereum is testing the critical $2,620–$2,630 support zone, aligning with the lower boundary of its descending channel. Analysts monitor for a potential wave-4 bounce, supported by whale accumulation of over 114,000 ETH and shifting ETF inflows, signaling possible recovery toward $2,800–$2,900 if structure holds.
-
ETH hits $2,620–$2,630 support: This zone matches the descending channel’s lower edge, a key level for potential reversal.
-
Wave-4 setup in focus: A five-wave upward move could confirm recovery, with analysts awaiting clear price reaction.
-
Whale buys 114,684 ETH amid ETF shifts: Holdings reach $1.34 billion, while BlackRock sees outflows and Fidelity inflows, totaling $16.86 billion in AUM.
Ethereum support zone at $2,620–$2,630 draws attention as whales accumulate and ETFs fluctuate. Discover analysis on wave patterns and market flows—stay informed on ETH’s next move today.
What is Ethereum’s Current Support Zone and Why Does It Matter?
Ethereum’s support zone at $2,620–$2,630 represents a pivotal level where the cryptocurrency is currently testing resilience amid ongoing market pressures. This area aligns precisely with the lower boundary of the descending channel that has defined ETH’s price action since its September peak, making it a focal point for traders. A confirmed reaction here could signal the start of a corrective wave-4 pattern, potentially leading to a rebound if key technical confirmations emerge over the next one to two weeks.
Ethereum tests the $2,620–$2,630 support zone as analysts track a possible wave-4 setup, whale accumulation, and shifting ETF flows.
- ETH reaches the $2,620–$2,630 support zone, aligning with the lower boundary of its descending channel.
- Analysts watch for a confirmed reaction, noting a five-wave rise is needed to validate a potential wave 4.
- A whale adds 114,684 ETH as ETF flows shift, while ETH attempts to reclaim the $2,800–$2,900 range.
Ethereum trades near the $2,620–$2,630 region, a zone repeatedly marked by analysts as the next downside target. This level also aligns with the lower boundary of the descending channel that guides current market structure. The area now serves as a logical support zone, and traders watch for a clear reaction over the coming sessions.
How Is Ethereum’s Price Structured Within the Descending Channel?
Ethereum’s price trajectory reflects a classic descending channel pattern, characterized by successive lower highs and lower lows since the September high. According to analysis from More Crypto Online, this channel confines ETH’s movements, with Fibonacci extensions pinpointing the 100 percent level at approximately $2,628—a threshold ETH has now touched. Market participants emphasize that while candles remain above deeper supports between $2,431 and $2,145, the mid-channel hold near $2,620–$2,630 underscores the zone’s significance. For a wave-4 correction to materialize, price must exhibit a structured five-wave advance, breaking above immediate resistance while respecting the channel’s upper limits around $3,170–$3,553. This setup, drawn from Elliott Wave principles, requires vigilant monitoring, as premature bounces without confirmation could lead to further downside. Historical data shows that reactions at channel boundaries often precede volatility spikes, with ETH’s 30-day volatility index hovering around 45 percent, per market trackers. Expert insights from technical analysts highlight that sustaining above this support could validate bullish divergence on RSI indicators, currently reading 38, suggesting oversold conditions ripe for reversal.
$ETH
Ethereum has reached the 2,620–2,630 USD region, which I have repeatedly mentioned as the next downside target. This area also aligns with the lower boundary of the trend channel, so the reaction here is important.
I am still tracking the idea that ETH may start its next… pic.twitter.com/XON9f792M3
— More Crypto Online (@Morecryptoonl) November 23, 2025
More Crypto Online also tracks the idea that ETH may start its next bounce from this zone during the coming one to two weeks. The potential reaction could form circle wave 4, yet the structure requires confirmation. Analysts state that a clear five-wave move upward or a defined reaction must appear before treating any bounce as wave 4.
Market candles stay above the deeper extension cluster between $2,431 and $2,145, and price holds near the mid-channel area. The resistance zone for a possible wave 4 remains between $3,170 and $3,553, which aligns with the upper boundary of the channel.
Frequently Asked Questions
What Does Whale Accumulation Mean for Ethereum’s Support Zone?
Whale accumulation refers to large-scale purchases by major holders, such as the recent acquisition of 114,684 ETH valued at $314 million, boosting one wallet’s total to 489,696 ETH or about $1.34 billion. This activity at the $2,620–$2,630 support zone signals confidence in ETH’s long-term value, potentially stabilizing price and countering selling pressure from ETF outflows.
Is Ethereum Poised for a Bounce from the $2,620 Level According to Analysts?
Yes, analysts like those from More Crypto Online suggest Ethereum could initiate a wave-4 bounce from the $2,620–$2,630 support, provided a clear five-wave structure emerges upward. With RSI showing oversold signals and whale buys adding support, a move toward $2,800–$2,900 seems plausible if the descending channel holds without deeper breaches—ideal for voice queries on ETH’s short-term outlook.
Key Takeaways
- Critical Support Test: Ethereum’s alignment at $2,620–$2,630 with the channel’s lower bound offers a prime reversal opportunity if buying volume increases.
- Whale and ETF Dynamics: A major whale’s $314 million purchase contrasts with mixed ETF flows, highlighting institutional interest amid BlackRock outflows and Fidelity inflows totaling $16.86 billion AUM.
- Wave-4 Confirmation Needed: Traders should watch for a five-wave rally to validate recovery, targeting $3,300–$3,400 while monitoring CME gaps for quick fills.
Whale Accumulation and ETF Market Activity
A large holder acquired 114,684 ETH in 48 hours, worth $314 million. This brings total holdings of that wallet to 489,696 ETH, valued near $1.34 billion. Market observers note that the purchase occurs as Ethereum maintains steady trading near current levels.
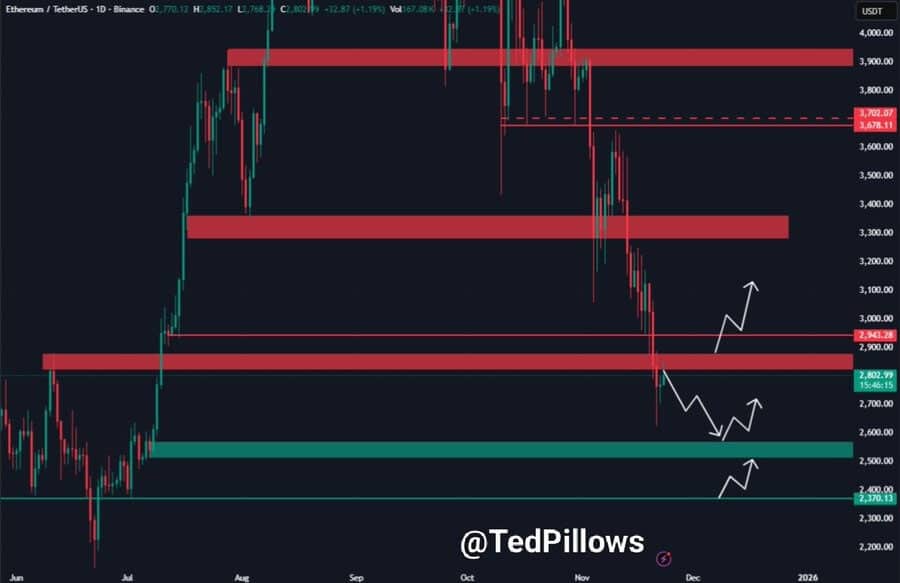
Source: TedPillows(X)
ETF data from SoSoValue shows varied inflows and outflows across the sector. BlackRock’s ETHA records continued redemptions, while Fidelity’s FETH attracts new inflows. Total assets under management for Ethereum ETFs reach $16.86 billion, with cumulative inflows near $12.63 billion.
According to Ted Pillows, “ETH is trying to reclaim the $2,800–$2,900 level,” and he reports that a move toward $3,300–$3,400 may follow if structure supports it. However, he notes that weekend moves can create new CME gaps that often fill within one to two weeks.
Conclusion
Ethereum’s test of the $2,620–$2,630 support zone, coupled with whale accumulation and evolving ETF flows, positions the cryptocurrency at a crossroads in its descending channel pattern. As analysts from More Crypto Online and Ted Pillows underscore the need for structural confirmation in a potential wave-4 setup, the coming sessions will clarify if ETH can reclaim higher ranges like $2,800–$2,900. Investors should remain vigilant, tracking on-chain data and technical indicators, to capitalize on emerging opportunities in this dynamic market environment.
Comments
Other Articles
Vitalik Buterin: The AI Revolution in DAO Management
February 23, 2026 at 02:58 PM UTC
BitMine Boosts Ethereum Stake to 461K ETH, Eyes Network Share Growth
January 1, 2026 at 08:06 PM UTC
Ethereum Inflow to Binance Surges to 24,500 ETH, Hinting at Short-Term Bearish Pressure
January 1, 2026 at 05:00 PM UTC