Ethereum’s Expanding Diagonal May Target $9,000–$18,000 in Wave C Phase
ETH/USDT
$31,047,650,067.90
$2,386.02 / $2,174.06
Change: $211.96 (9.75%)
-0.0008%
Shorts pay

Contents
Ethereum’s expanding diagonal pattern on the biweekly chart signals an ongoing wave v in its final a-b-c corrective phase, with potential targets for wave c reaching $9,000 to $18,000. Analysts highlight higher lows and highs, supported by key liquidity zones and persistent spot outflows amid high open interest.
-
Ethereum’s expanding diagonal forms a textbook structure as wave v completes its a-b-c sequence.
-
Wave b holds at critical liquidity support, while wave a has surpassed $3,650 resistance.
-
Open interest exceeds $35 billion despite $200 million in spot outflows, indicating sustained trader interest.
Ethereum expanding diagonal pattern nears completion in wave v, targeting $9,000-$18,000. Discover key supports, resistances, and market insights for informed trading decisions in this volatile crypto landscape.
What is Ethereum’s Expanding Diagonal Pattern?
Ethereum’s expanding diagonal is a technical formation observed on the biweekly chart, characterized by higher highs and higher lows within a broadening wedge, currently in wave v of an Elliott Wave structure. This pattern indicates a corrective phase concluding with an a-b-c sequence, where wave a has broken above the $3,650 resistance level. As Ethereum trades at around $2,713, the structure suggests building momentum toward higher targets while testing key support zones.
Ethereum forms a textbook Expanding Diagonal as wave v completes its a-b-c phase, with analysts noting wave c may target the $9,000–$18,000 zone.
- Ethereum forms a “textbook Expanding Diagonal” as wave v enters its final a-b-c phase.
- Analysts say wave c may reach $9,000–$18,000 while wave b holds a key liquidity support zone.
- Spot outflows persist, yet open interest stays high as traders watch major support and resistance.
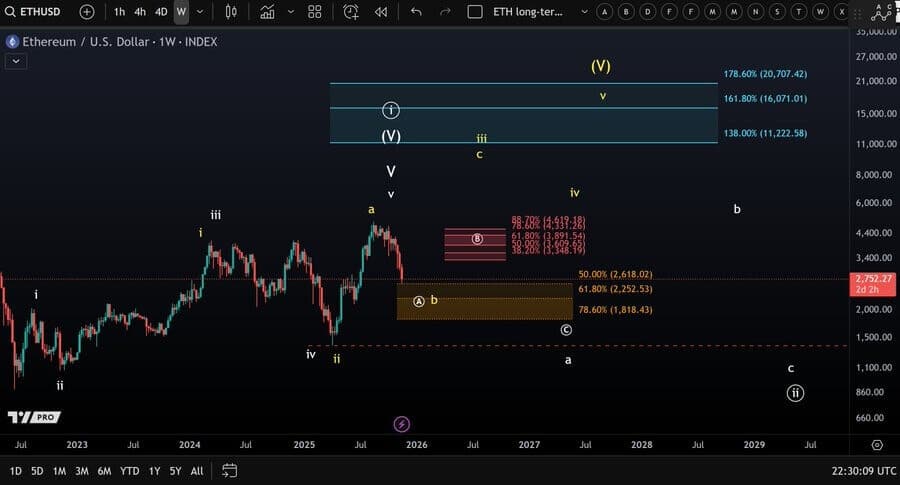
Ethereum continues to trade inside a broad rising wedge while the biweekly structure follows a textbook Expanding Diagonal pattern. The current wave v phase moves toward its last stages, and the chart shows the complete a-b-c corrective sequence developing near the upper boundary. Wave a has already moved above the $3,650 horizontal barrier, and wave b now rests on a key liquidity zone. At the time of writing, ETH was trading at $2,713.
How Does Ethereum’s Wave V Structure Impact Price Targets?
Ethereum’s wave v in the expanding diagonal pattern is entering its concluding a-b-c corrective phase, with wave c projected to aim for the $9,000 to $18,000 range based on chart projections. Analysts, including Gert van Lagen, emphasize that the pattern maintains consistent spacing between swings, aligning with historical turning points from prior waves. Supporting data from Coinglass reveals open interest climbing above $35 billion in mid-August 2025, even as spot outflows exceeded $200 million in recent sessions, underscoring robust trader participation despite price corrections. This structure’s reliability is further evidenced by similar patterns in indices like the DJIA, where expanding diagonals have preceded significant breakouts. Ethereum’s higher-time-frame moving averages converge with fair value gaps at current support levels around $2,700, providing a buffer for potential upside moves. Expert analysis from MoreCryptoOnline highlights that the weekly support between $1,820 and $2,620 has held firm, allowing for a possible B wave extension before reversal. Key resistance levels at $3,017–$3,050 and $3,373 loom overhead, with liquidity pools near $2,550 influencing short-term volatility. These elements collectively suggest Ethereum’s expanding diagonal could drive substantial gains if support holds, backed by on-chain metrics showing sustained accumulation.
Expanding Diagonal Structure Gains Attention
According to analysis prepared by Gert van Lagen, Ethereum maintains higher lows and higher highs across the biweekly chart. Wave b now tests support inside a Fair Value Gap that aligns with a higher-time-frame moving average band, and traders see repeated reactions in this area. The zone also matches past turning points from wave 2 and wave 4, and the structure keeps a steady rhythm.
#Ethereum follows a textbook Expanding Diagonal pattern.
Wave v is in its final stages, forming the concluding corrective a-b-c structure.
+ Wave a has already broken above the horizontal resistance at $3,650.
+ Currently, wave b is finding support within the key liquidity zone… pic.twitter.com/3gA199O2Eq
— Gert van Lagen (@GertvanLagen) November 21, 2025
The chart shows a path for wave c toward the green box between $9,000 and $18,000. The upper wedge line records this target zone, and the spacing between each major swing remains even across the entire pattern.
A comparison chart of the DJIA hourly pattern also appears in the analysis, and it shows a related expanding structure with clear swing labels. ETH spot data records steady outflows through recent months, and some sessions saw more than $200 million in withdrawals. Coinglass data shows open interest rising from below $15 billion to above $35 billion in mid-August, and the level stayed high even as price softened.
Key Levels and Market Conditions
According to MoreCryptoOnline, Ethereum now sits near a major weekly support area between $1,820 and $2,620, and this zone has held during the current correction. From here, a move into a broader B wave remains possible, and the service notes that the daily chart still allows another pullback before a larger reaction forms.
Source: MoreCryptoOnline(X)
Technical levels remain clear. Resistance sits at $3,017–$3,050 and then at $3,373, while support stands at $2,852 and $2,945. Liquidity zones remain near $2,700 and $2,550, and the chart shows compressing price action with lower highs and tight swings. Traders watch for a break of these zones as the market prepares for stronger movement.
Frequently Asked Questions
What are the projected targets for Ethereum’s wave c in the expanding diagonal?
The projected targets for Ethereum’s wave c in the expanding diagonal pattern range from $9,000 to $18,000, as outlined in biweekly chart analysis. This zone aligns with the upper boundary of the rising wedge and maintains even swing spacing, supported by historical pattern precedents and current liquidity alignments.
Is Ethereum’s current support level reliable amid spot outflows?
Ethereum’s support near $2,620 to $1,820 has proven reliable during recent corrections, even with ongoing spot outflows totaling over $200 million. High open interest above $35 billion reflects continued trader confidence, positioning this zone as a key area for potential rebound in natural market dialogue.
Key Takeaways
- Ethereum’s expanding diagonal nears wave v completion: The a-b-c sequence shows wave a above $3,650, with wave b at liquidity support, setting up wave c for higher targets.
- Market metrics indicate resilience: Despite $200 million in outflows, open interest remains elevated at over $35 billion, signaling strong participation.
- Monitor key levels closely: Supports at $2,550–$2,700 and resistances at $3,017–$3,373 will determine the next breakout or pullback direction.
Conclusion
Ethereum’s expanding diagonal pattern underscores a methodical advance in wave v, with wave c poised to test ambitious $9,000–$18,000 levels while wave b anchors at vital liquidity zones. Backed by data from sources like Coinglass and insights from analysts such as Gert van Lagen, this structure highlights Ethereum’s potential for significant upside amid persistent market interest. As traders navigate compressing price action and key supports, staying attuned to these developments could yield strategic advantages in the evolving crypto market—consider reviewing your portfolio positions today for optimal readiness.
Comments
Other Articles
Vitalik Buterin: The AI Revolution in DAO Management
February 23, 2026 at 02:58 PM UTC
BitMine Boosts Ethereum Stake to 461K ETH, Eyes Network Share Growth
January 1, 2026 at 08:06 PM UTC
Ethereum Inflow to Binance Surges to 24,500 ETH, Hinting at Short-Term Bearish Pressure
January 1, 2026 at 05:00 PM UTC