If Bitcoin Breaks Its Weekly Support, Where Will Its Target Be? Current BTC Analysis!
BTC/USDT
$34,057,419,982.02
$76,000.00 / $72,419.28
Change: $3,580.72 (4.94%)
+0.0041%
Longs pay

Contents
- Bitcoin has been experiencing a downward trend for the past 2 weeks.
- Where are Bitcoin’s critical support and resistance levels?
- If Bitcoin breaks the $27,000 support, where will the target for the downward trend be?
Will Bitcoin experience a drop to $25,000? What level must be broken for Bitcoin’s price to rise? Current Bitcoin analysis!
Weekly Bitcoin Price Analysis! Will There Be an Upward Trend?
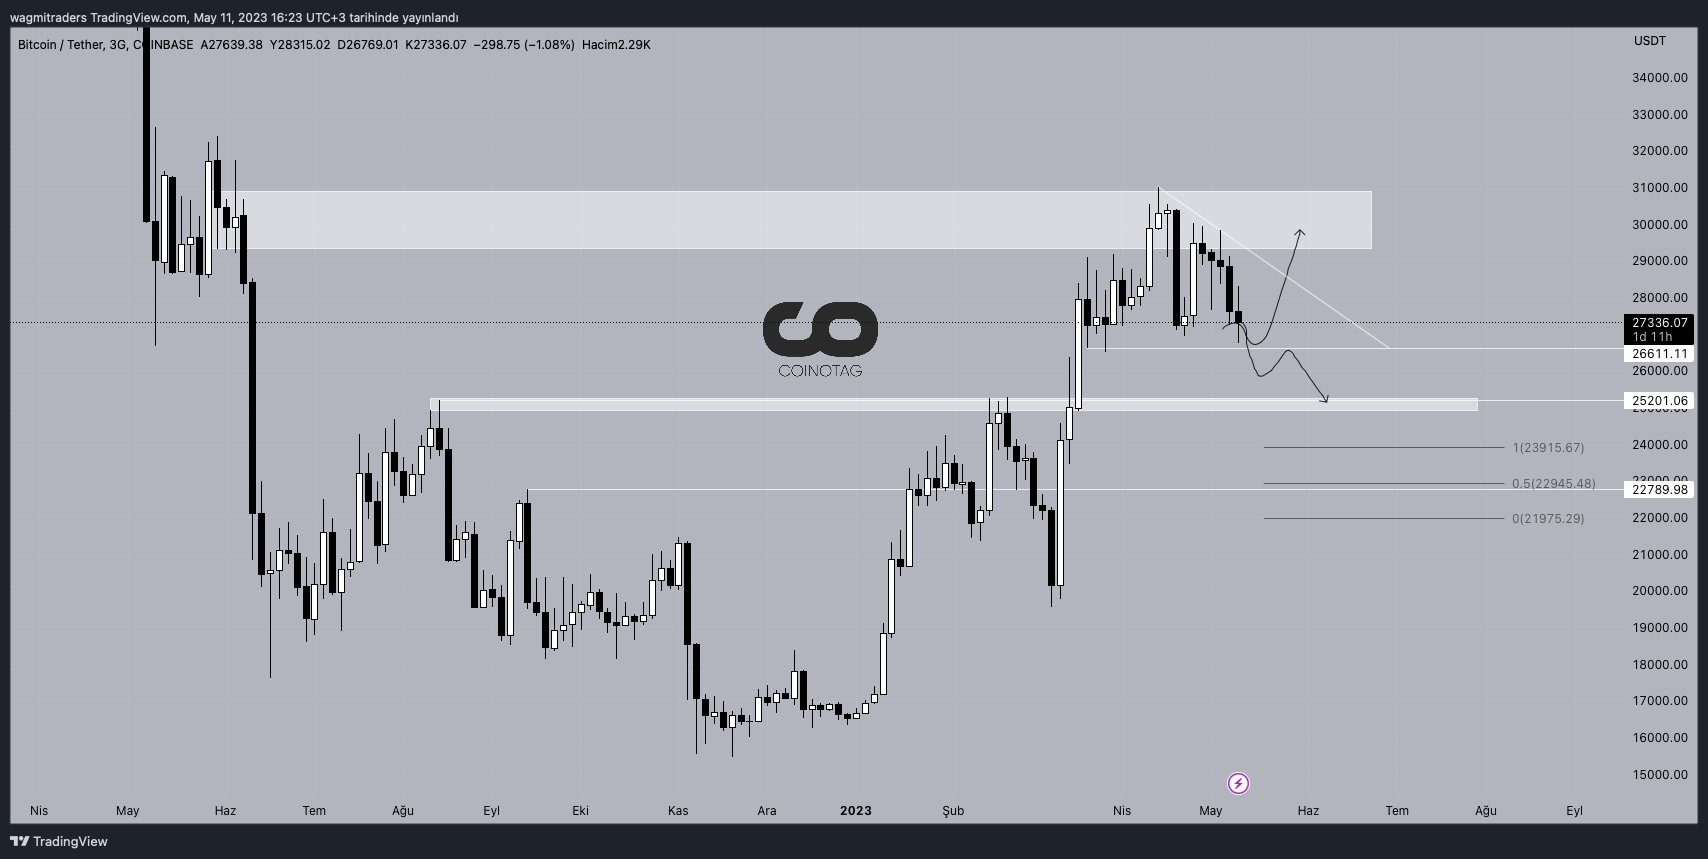
Weekly Bitcoin Price Chart Source: TradingView
If Bitcoin’s price continues to close weekly candles above the $26,600 level mentioned in the analysis, it can achieve an upward trend back up to the $30,000 level.
Bitcoin’s price is in an upward trend as long as it stays above the $26,600 level mentioned in the analysis.
If Bitcoin’s price closes weekly candles below the $26,600 level, the target for the downward trend will be $25,200.
Closing weekly candles below the $25,200 support could cause the downward trend to drop to the range of $24,000 – $22,000.