

Is the BTC Market at a Permanent Bottom? Matrixport Analysis
BTC/USDT
$14,966,062,947.50
$65,808.59 / $63,739.75
Change: $2,068.84 (3.25%)
+0.0030%
Longs pay

Crypto market sentiment has fallen to extremely low levels, and according to Matrixport analysts, a “permanent bottom” that exhausts selling pressure may form. In Matrixport’s Bitcoin (BTC) Fear and Greed Index, the 21-day moving average fell below zero and started rising, indicating that selling pressure is easing and the market is stabilizing. The firm warns that prices could fall further in the short term, while noting that historically these negative readings have offered entry opportunities.
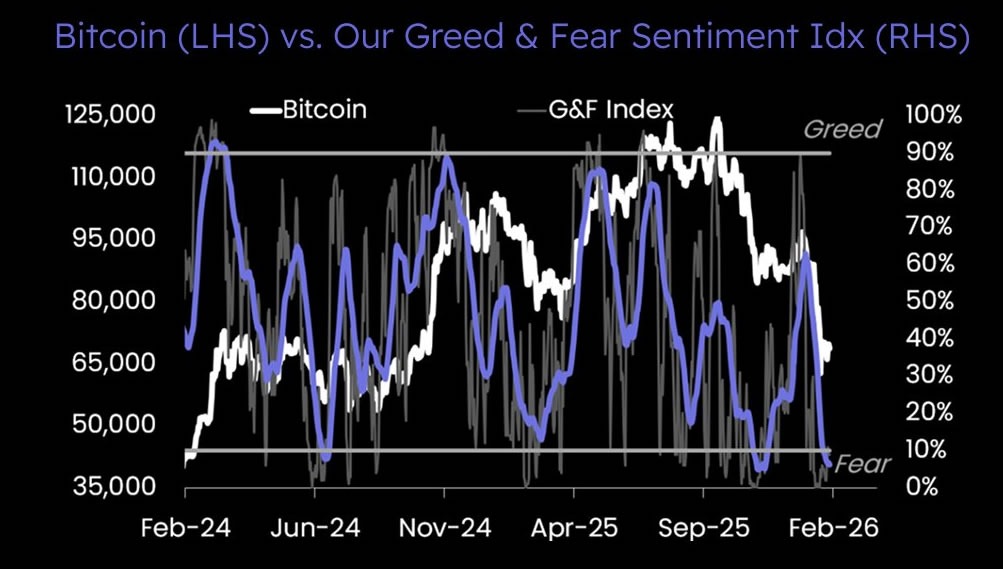
Bitcoin sentiment hits extreme lows. Source: Matrixport
BTC Fear and Greed Index in Historical Decline
Matrixport metric was at similar lows after market drops in June 2024 and November 2025. Alternative.me Fear and Greed Index at 10/100 is the lowest “extreme fear” level since June 2022. If BTC closes February negative, it will experience the longest monthly loss streak since 2018. These levels, as we also emphasize on our BTC detailed analysis pages, usually give recovery signals.
Hive Chairman’s BTC Oversold Zone Analysis
Hive Chairman Frank Holmes stated that BTC is two standard deviations below its 20-day average, seen three times in the last five years, paving the way for short-term bounces; he remains optimistic long-term.
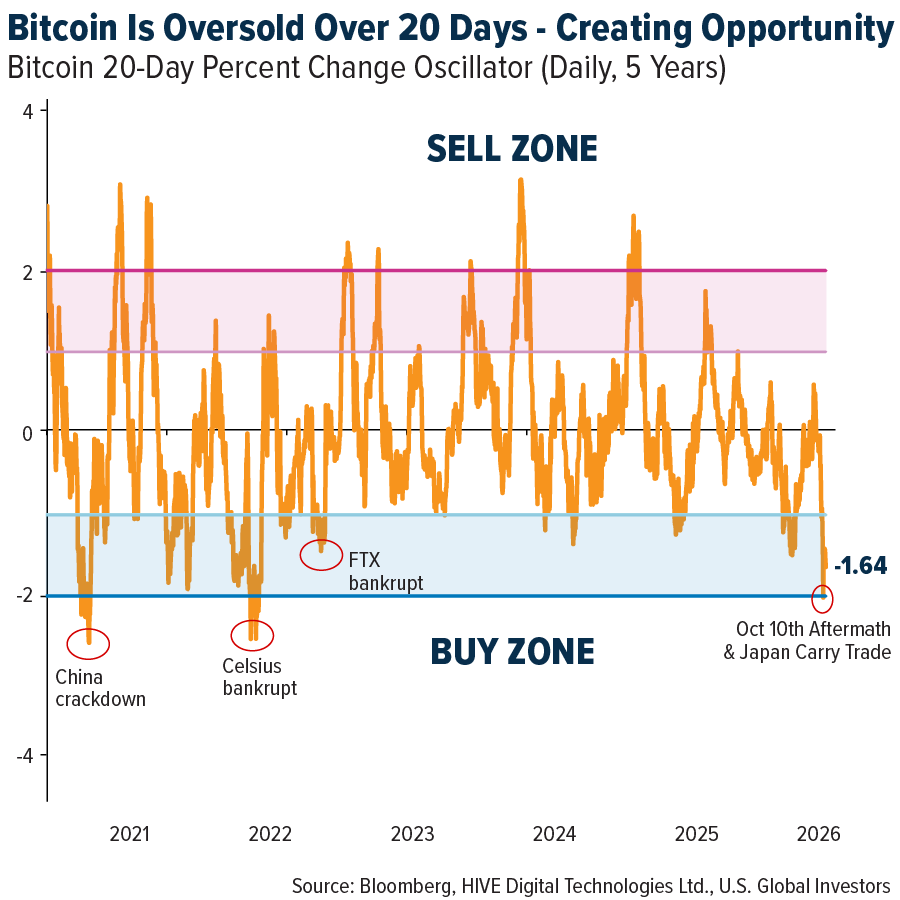
BTC is in historic oversold territory, creating opportunity. Source: Hive
Current BTC Technical Indicators and RSI Oversold
BTC price at 68,355.22 USD level, 24-hour change -0.06%. RSI at 35.67 in oversold region, trend downtrend and Supertrend bearish. Trading below EMA 20: 72,841.75 USD. The table below shows critical levels:
| Level | Price (USD) | Score | Distance | Sources |
|---|---|---|---|---|
| S1 (Strong Support) | 65,486.81 | 74/100 ⭐ | -4.36% | Keltner Lower, Fibo 0.114 |
| S2 (Strong Support) | 60,000.00 | 65/100 ⭐ | -12.37% | Fibo 0.0 |
| R1 (Strong Resistance) | 70,104.47 | 86/100 ⭐ | +2.38% | R3, Prev Day High |
| R2 (Medium Resistance) | 83,623.68 | 58/100 | +22.13% | BB |
The oversold condition in RSI creates short-term rebound potential. Check BTC futures for detailed charts.
Positive Reversal in Weekly BTC Candlestick Chart
Latest breaking news: Bitcoin weekly candlestick chart has turned positive and rose 8% from its lowest level with 1 day 12 hours to weekly close. This is a signal consistent with Matrixport’s bottom prediction.
Metaplanet BTC Losses Market Impact
Metaplanet announced a net loss of 619 million dollars in Bitcoin valuation but BTC holdings reached 35.102 BTC. Corporate losses are increasing overall market fear but HODL strategy supports long-term optimism. Similar situations in the past triggered bottoms.
Strategic Recommendations for BTC Investors
- Short-term, monitor S1 support (around 65K).
- Watch for entry opportunities with oversold RSI.
- Let Holmes’ optimism guide long-term holders.
COINOTAG does not provide financial advisory services. This content is for informational purposes only and should not be considered investment advice. Cryptocurrency investments involve high risk.
Add COINOTAG as a Preferred Source
Add COINOTAG to your preferred sources in Google News and Search to see our coverage first.
Add on GoogleRelated Tags
AI-generated, AI-reviewed, under COINOTAG editorial oversight.
Comments
More From COINOTAG
BlackRock moved 3.126K $BTC ($203M) from its IBIT Bitcoin ETF wallet to Coinbase Prime.
July 24, 2026 at 12:23 PM UTC
Another $163M $BTC Accumulated by BlackRock BlackRock IBIT Bitcoin ETF wallet received 2,469.25 $BTC ($163.1M) from...
July 22, 2026 at 06:41 PM UTC
Bitcoin Holds Near $66K as Silver Breaks Two-Month Downtrend
July 21, 2026 at 05:29 PM UTC