KAVA Analysis: From Which Level Can KAVA Start Its Rise?
KAVA/USDT
$2,227,833.97
$0.0589 / $0.0561
Change: $0.002800 (4.99%)
-0.0069%
Shorts pay

Contents
- The price chart of Kava in the 4-hour time frame shows that it is moving with significant Fibonacci support.
- If Kava manages to hold on to the $0.8788 level, it can continue its upward movement towards the $0.9535 level.
- However, if a 4-hour candle closes below the $0.8788 support, the downward target may move towards the $0.85 support.
Hello! In this article, we will focus on the current price analysis of Kava and explore potential investment opportunities. Kava has become an important asset in the crypto world recently and has the potential to be interesting for investors. However, please note that this article does not contain investment advice. Our aim is to provide you with information by analyzing Kava’s price movements and guide you in your decisions. Now, let’s take a closer look at Kava’s price chart and examine potential opportunities.
Medium-Term KAVA Price Analysis!
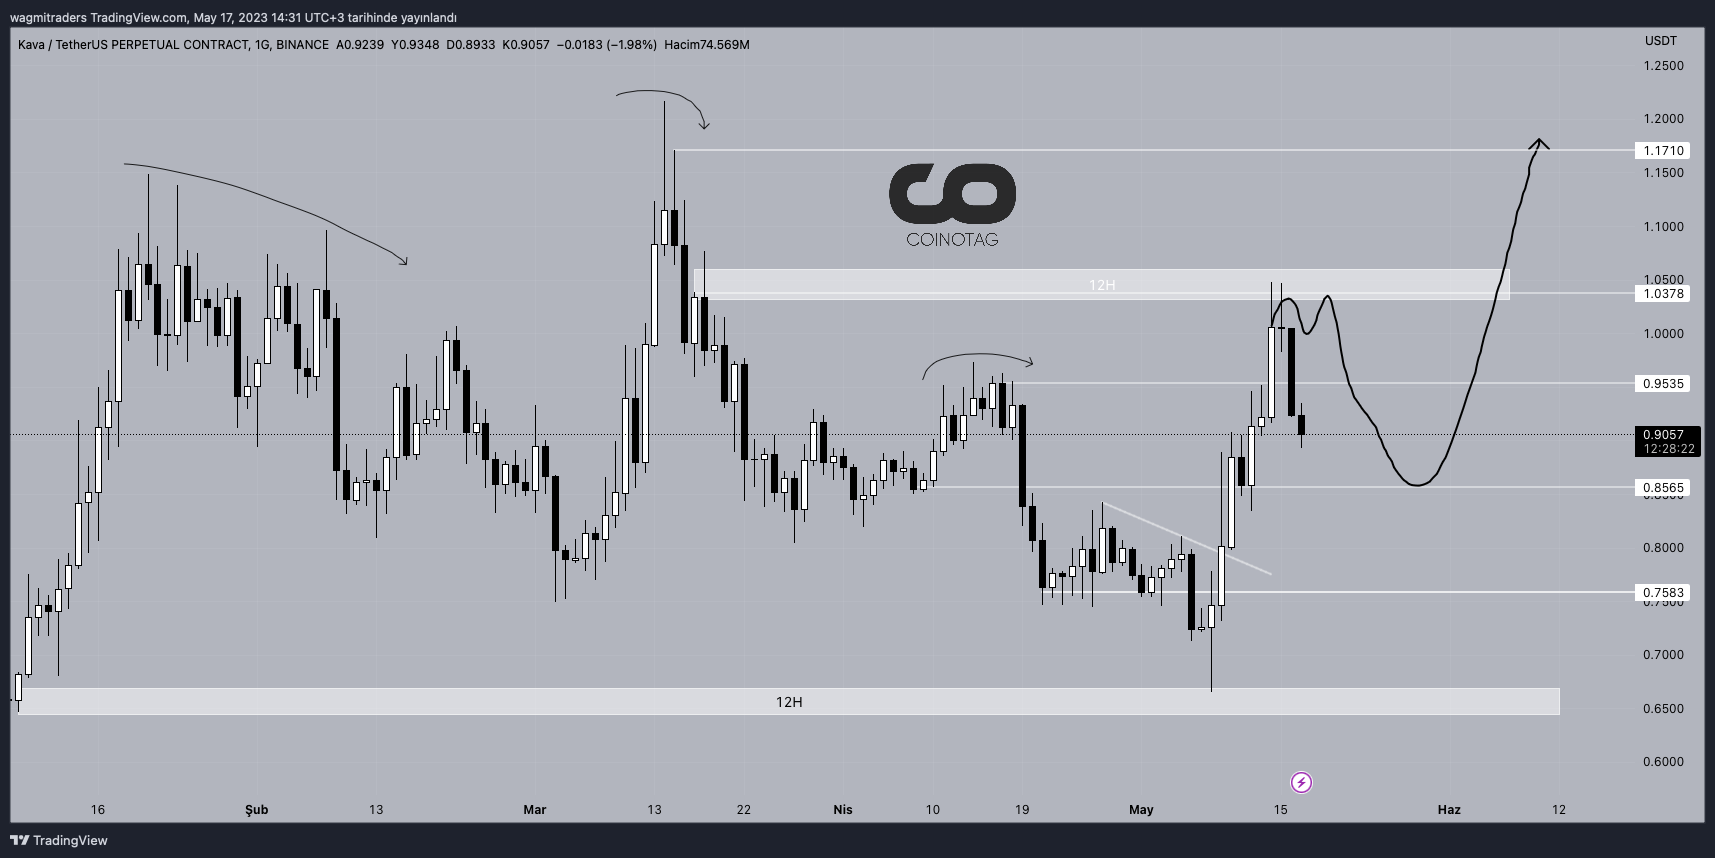
Daily Kava Price Chart Source: TradingView
When Kava’s current price chart is examined, it can be seen that the downward movement mentioned in the previous analysis continues. As we expressed in the previous analysis, KAVA could not break the $1.03 level and started the downward trend.
Kava’s price chart is moving close to an important support area of $0.8565. If the Kava price continues its decline towards $0.8565, it needs to make a daily candle close above this support area.
However, in order for the KAVA price to rise, it must first make a daily candle close above the $0.9534 level.
If the Kava price makes a daily candle close above the $0.8565 support, it can start the upward movement from this area towards $1.03 levels again.
However, if the KAVA price closes below the $0.8565 support on a daily basis, the downward movement may continue towards the $0.81 support.
Therefore, it is important for investors to monitor how Kava reacts to the specified support and resistance levels. Breaking or holding these levels can provide clues about the direction of price movement.
Short-Term KAVA Price Analysis!
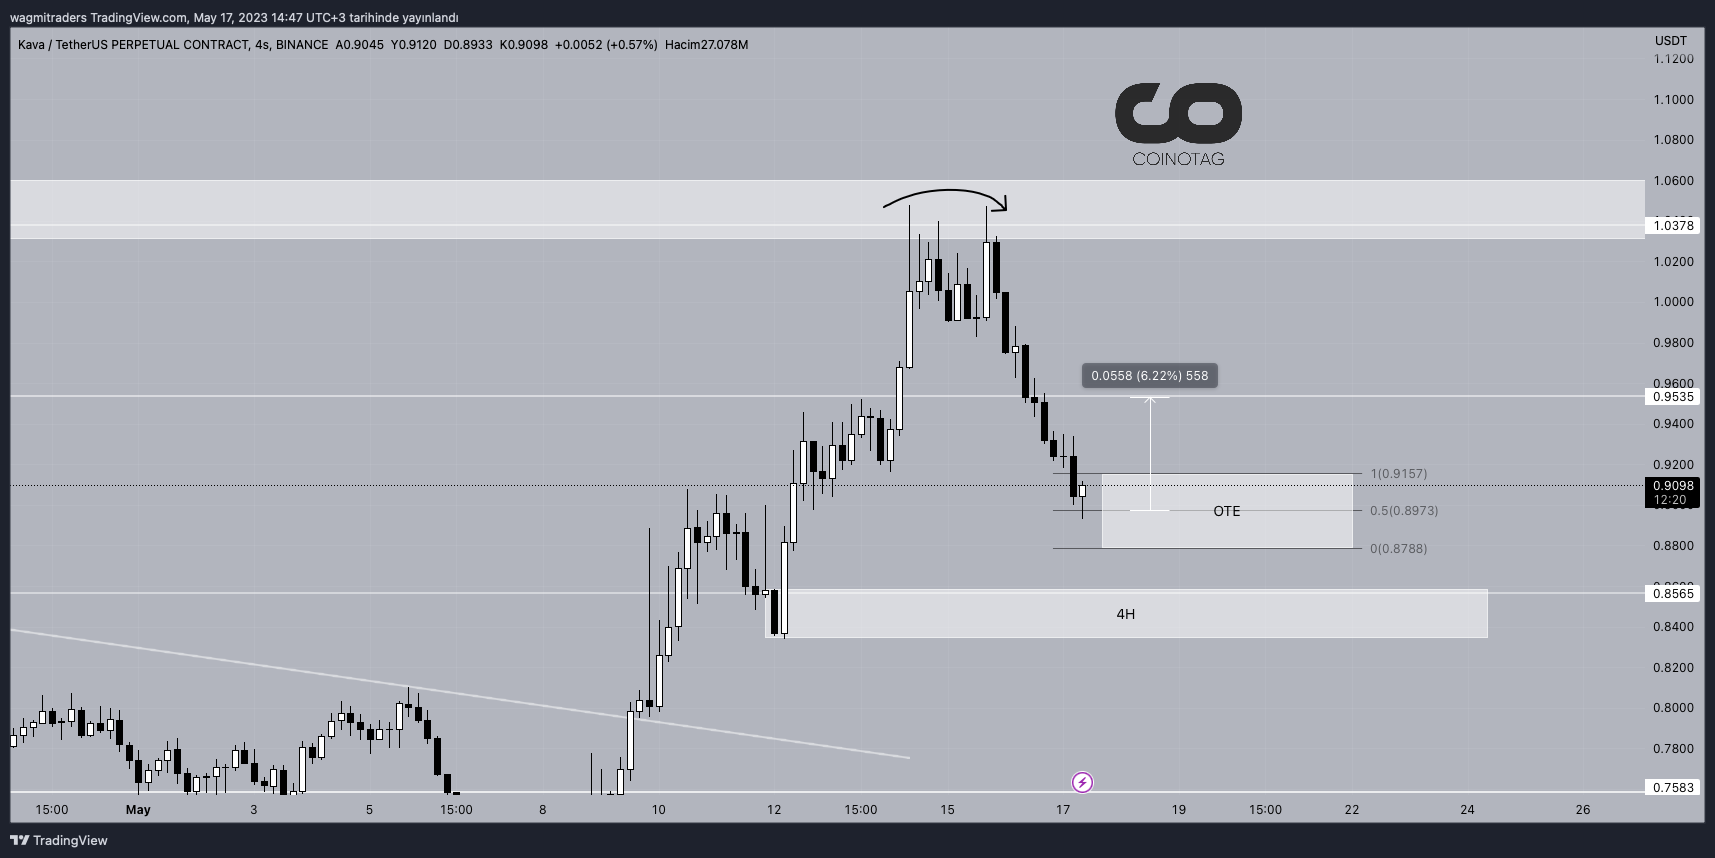
4 Hour Kava Price Chart Source: TradingView
When Kava’s 4-hour time frame price chart is examined, it is observed that it is moving with significant Fibonacci support. Currently, Kava is trying to start its upward movement from the OTE (Optimal Trade Entry) zone.
If the Kava price manages to hold on to the $0.8788 level in the short term, it can continue its upward movement from this support area towards the $0.9535 level.
However, if the Kava price closes below the $0.8788 level on a 4-hour basis, the downward target will be the $0.85 support mentioned in the above analysis.
If the Kava price shows success in holding on to the $0.85 support mentioned in the analysis, it can start the upward movement from this area. However, if 4-hour candle closes occur below the $0.85 support, the downward movement may continue towards the $0.803 level.
Therefore, it is important for investors to monitor the specified support and resistance levels of Kava. Holding or breaking these levels can provide an important clue about the direction of price movement.
Comments
Other Articles
Bitcoin Price Analysis: Will the Uptrend Continue?
2/8/2026
Ethereum 2.0 Update: How Will It Affect the Crypto Market?
2/7/2026
The Coming of Altcoin Season: Which Coins Will Stand Out?
2/6/2026
DeFi Protocols and Yield Farming Strategies
2/5/2026