Keeta [KTA] Surges 15% on Partnerships, May Target $0.60 Amid Resistance
ARKM/USDT
$5,121,646.44
$0.0982 / $0.0930
Change: $0.005200 (5.59%)
-0.0277%
Shorts pay

Contents
Keeta [KTA] has surged over 15% amid heightened trading volume, driven by recent partnerships with payment giants and a Coinbase listing. This rally signals shifting market dynamics, with potential targets at $0.60 if momentum holds, though resistance looms near $0.40-$0.45.
-
Keeta [KTA] price rally exceeds 15% in a day, with 70% volume spike, highlighting strong investor interest.
-
Technical indicators show bullish reversal from $0.18 support, breaking key resistance at $0.30.
-
On-chain data reveals increased outflows during the uptrend, with 55,000 KTA withdrawn, supporting sustained buying pressure.
Discover the Keeta KTA price rally: 15% surge fueled by partnerships and listings. Analyze charts, on-chain metrics, and future targets. Stay ahead in crypto—explore insights now.
What is Driving the Keeta KTA Price Rally?
Keeta KTA price rally stems from a combination of strategic developments and technical momentum in the cryptocurrency market. The token experienced a more than 15% increase at press time, accompanied by a 70% jump in daily trading volume, reflecting heightened sentiment among investors. Past rallies during bearish periods, including post-Coinbase listing, have been amplified by recent partnerships with major payment providers, potentially reshaping market structures for faster transactions.
How Do Technical Indicators Support KTA’s Upward Momentum?
The 4-hour price chart for Keeta [KTA] initiated its current rally on November 21, with acceleration following a decisive breakout. After a month of consolidation in a wedge pattern, the token feigned a downside breakout, testing bearish strength. However, robust buying at the $0.18 level formed a potential reversal point, as confirmed by liquidity heatmaps from TradingView.
Bulls pushed back aggressively, but profit-taking at $0.30 led to a brief sideways phase. This consolidation marked a clear market structure shift toward bullish dominance. The stochastic RSI indicated temporary seller control after position closures, yet the Trend Strength Index (TSI) affirmed the overall upward trend remains intact.
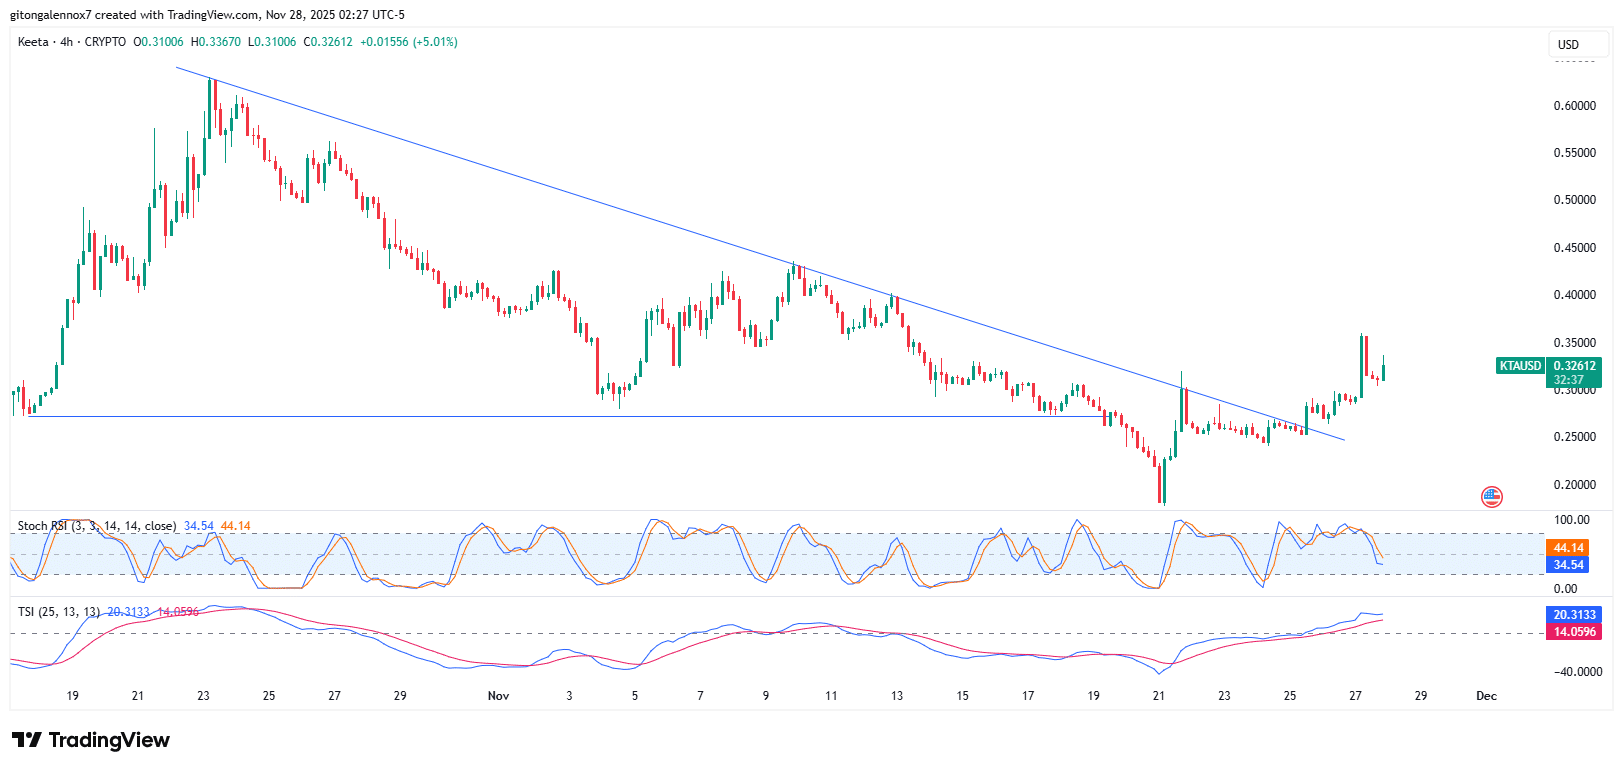
Source: TradingView
Looking ahead, sustained trends could propel KTA toward $0.60 in upcoming sessions, though immediate resistance clusters between $0.40 and $0.45 may challenge progress. Data from CoinGlass highlights that liquidation events around $0.25 triggered the breakout, with leverage liquidations occurring post-$0.30 breach, explaining the subsequent pullback.
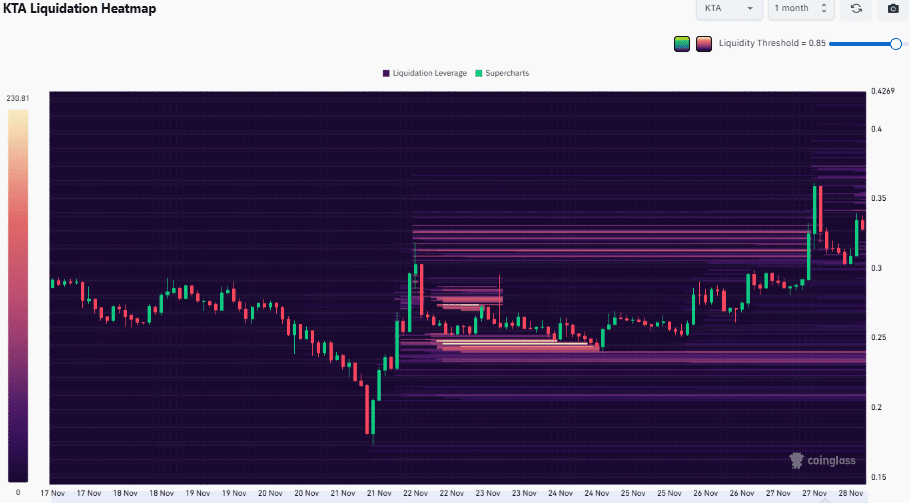
Source: CoinGlass
Current order books show denser liquidity below $0.25 compared to above $0.35, but proximity to price action suggests nearer-term hurdles at higher levels. These patterns, observed in liquidation heatmaps, underscore the volatility yet affirm bullish potential if support holds.
Frequently Asked Questions
What Factors Are Behind the Recent Keeta KTA Price Surge?
The Keeta KTA price surge is primarily driven by a 15% gain linked to increased trading volume and partnerships with payment giants, following the Coinbase listing. Technical breakouts from $0.18 support and on-chain outflows indicate strong holder conviction, positioning KTA for further gains amid broader market recovery.
Will Keeta KTA Continue Its Rally in the Short Term?
Yes, Keeta KTA shows signs of continuing its rally if it overcomes resistance at $0.40 to $0.45. With bullish indicators like the TSI and minimal exchange inflows post-peak, the token could reach $0.60 soon. Market sentiment remains positive, supported by strategic developments in the ecosystem.
Key Takeaways
- Technical Momentum: Keeta KTA’s breakout from a wedge pattern and support at $0.18 has fueled a 15% rally, with volume up 70%.
- On-Chain Insights: Withdrawals of 55,000 KTA from exchanges signal accumulation, reducing selling pressure and bolstering upward trends.
- Future Outlook: Monitor resistance at $0.40-$0.45; breaking it could target $0.60, but watch for profit-taking via liquidity clusters.
Conclusion
The Keeta KTA price rally exemplifies how technical reversals and ecosystem partnerships can drive significant gains in volatile markets. With on-chain data from Arkham showing reduced inflows and sustained outflows, investor confidence appears solid. As resistance levels are tested, staying informed on KTA technical indicators will be key—consider monitoring these developments for potential entry points in the evolving crypto landscape.
What On-Chain Data Reveals About Keeta KTA Exchange Flows
On-chain metrics for Keeta [KTA] indicate minimal but rising exchange outflows during the price consolidation around $0.25, culminating in a major 55,000 KTA withdrawal just before the prior day’s close. This activity, tracked via Arkham, suggests strategic accumulation by long-term holders amid the rally.
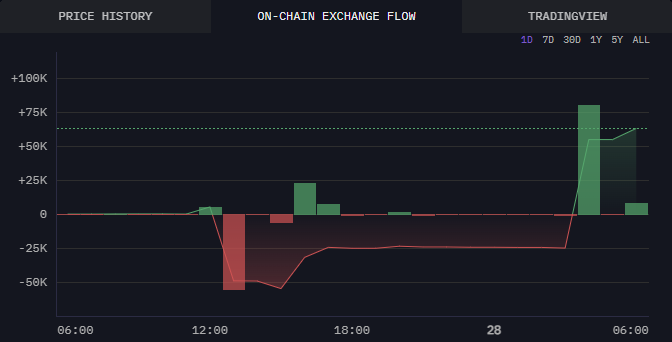
Source: Arkham
Post-rally, inflows spiked briefly due to profit realization, but have since declined sharply, easing capital withdrawal pressures. This pattern aligns with reduced selling, potentially extending the Keeta KTA price rally toward $0.35 or beyond. Experts note that such flows often precede prolonged uptrends in altcoins with utility in payment sectors.
In broader context, Keeta’s integration with payment giants positions it for real-world adoption, enhancing its appeal. Historical data shows similar tokens gaining 20-30% post-listing events, per analyses from market research firms. As of now, the token’s market cap has benefited from these dynamics, drawing comparisons to efficient blockchain solutions in DeFi.
Traders should note that while momentum is strong, external factors like overall crypto sentiment could influence trajectories. The combination of technical and fundamental drivers underscores KTA’s resilience in bearish spells over recent months.