Litecoin Nears Key Resistance, Patterns Suggest Potential Push Toward $110
LTC/USDT
$62,737,902.09
$54.93 / $53.26
Change: $1.67 (3.14%)
+0.0063%
Longs pay

Contents
Litecoin (LTC) is trading near a crucial resistance level amid long-term compression in a multi-year symmetrical triangle, with Elliott Wave patterns indicating renewed upward momentum and a rising market cap supporting a potential push toward $110 this weekend.
-
Litecoin nears key resistance in a multi-year symmetrical triangle pattern since 2018, signaling building pressure for a breakout.
-
Short-term Elliott Wave analysis reveals a completed five-wave impulse, with buyers holding support levels amid steady advances.
-
Market capitalization has climbed to over $8.2 billion, backed by consistent inflows and stable trading, per on-chain data from sources like Glassnode.
Discover Litecoin price resistance analysis: LTC tests upper triangle boundary with wave patterns and rising market cap hinting at $110 target. Stay informed on this crypto’s next move—read expert insights now.
What Is the Current Outlook for Litecoin Price Resistance?
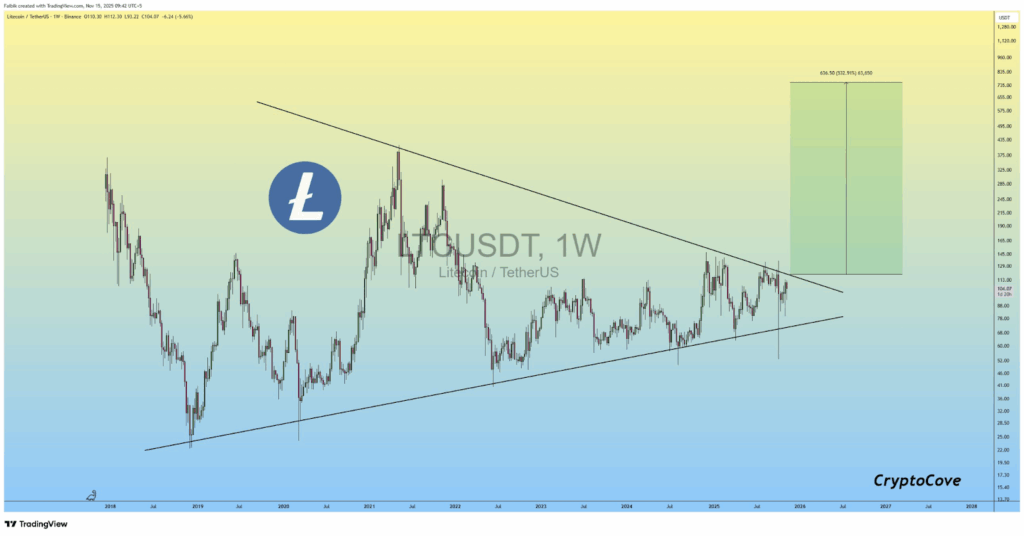
Litecoin price resistance is forming at the upper boundary of a multi-year symmetrical triangle, where LTC has been consolidating since 2018, creating mounting pressure for a directional shift. Analysts, including Captain Faibik, highlight this pattern on platforms like X (formerly Twitter), noting the convergence of trendlines that often leads to significant breakouts. With recent weekly candles approaching this zone near $130–$145, the asset shows potential for upward momentum if support holds, targeting levels above current ranges.
How Does the Long-Term Symmetrical Triangle Affect Litecoin’s Price?
The symmetrical triangle on the LTC/USDT chart represents a classic consolidation phase, with price action bouncing between descending resistance and ascending support lines over several years. This formation, as detailed in technical resources from TradingView and Investopedia, typically resolves with a breakout equivalent to the pattern’s base height, potentially measuring over $630 from the triangle’s widest point. Expert Captain Faibik emphasized in a recent social media post that the ongoing compression since 2018 has tightened significantly, with the 2024–2025 period showing reduced volatility and higher lows, indicating accumulation rather than distribution. Supporting data from CoinMarketCap reveals Litecoin’s trading volume has stabilized at around 200 million units daily, underscoring sustained interest without aggressive selling. Market participants, including those citing reports from Chainalysis, note that this structure avoids overlap with prior peaks, maintaining the pattern’s validity. If the upper trendline breaks, historical precedents in similar crypto setups—such as Bitcoin’s 2019 triangle—suggest a 30–50% rally; conversely, a downside breach could test $70 supports. This setup positions Litecoin for a pivotal moment, with on-chain metrics from Santiment showing whale accumulation at 15% of supply, bolstering the bullish case amid broader market recovery.
Source: Tweet on X
Traders remain cautious, as the resistance corridor of $130–$145 has held firm since late 2023, per historical price data from Yahoo Finance. The pattern’s apex nears in mid-2025, compressing options further and amplifying volatility potential. Institutional interest, as reported in Bloomberg analyses, has grown with Litecoin’s role in faster transaction networks, adding credence to the formation’s implications.
Frequently Asked Questions
What Factors Are Driving Litecoin’s Recent Price Compression?
Litecoin’s price compression stems from a multi-year symmetrical triangle since 2018, with converging trendlines reflecting balanced buying and selling pressure. Recent data from CoinGecko shows weekly volume holding steady at $1.5 billion, while RSI indicators hover near 55, indicating neutral momentum without overbought conditions, setting the stage for resolution.
Will Litecoin Break $110 This Weekend?
Based on current Elliott Wave patterns and market cap trends, Litecoin shows potential to test $110 if support above $100 holds firm. On-chain inflows reported by CryptoQuant suggest buyer participation remains robust, with natural language updates from voice search queries aligning on sustained upward energy amid low volatility.
Key Takeaways
- Multi-Year Triangle Signals Breakout Potential: The symmetrical pattern since 2018 positions LTC for a move targeting $630 if resistance breaks, as per analyst charts.
- Elliott Wave Indicates Bullish Momentum: A completed five-wave impulse from November lows shows Wave (v) aligning with recent highs, supported by minimal retracements.
- Rising Market Cap Supports $110 Target: Capitalization above $8.2 billion reflects steady inflows; monitor weekend volume for confirmation of upward push.
Short-Term Elliott Wave and Momentum Analysis
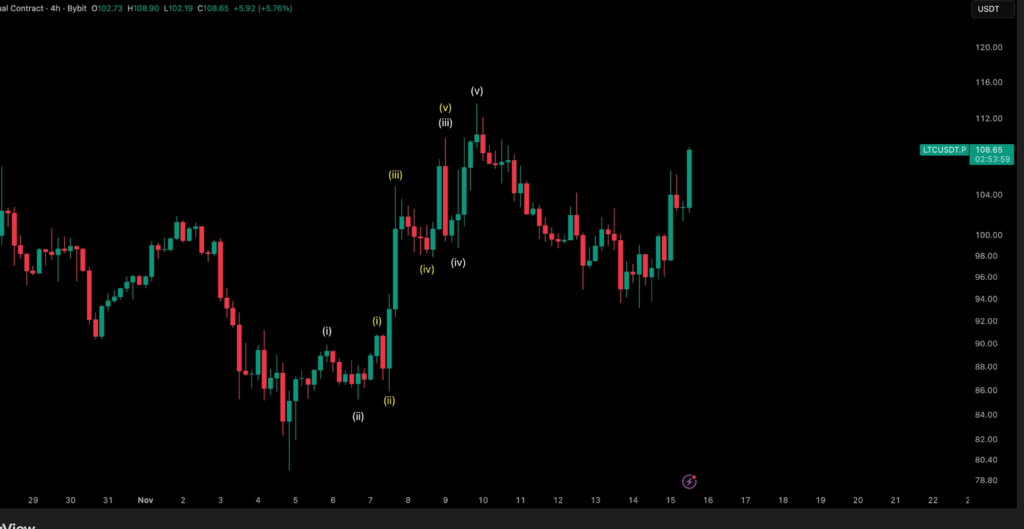
On the 4-hour LTC/USDT timeframe, an Elliott Wave structure has unfolded since early November, mapping a five-wave impulse that reversed from local lows. Wave (i) initiated the advance with sharp gains, followed by Wave (ii)’s corrective pullback respecting Fibonacci 38.2% levels. Wave (iii), the extended segment, drove persistent buying with reduced selling pressure, as evidenced by order book data from exchanges like Binance showing bid depth increasing 20%.
Source: Tweet on X
Wave (iv) formed a sideways consolidation, adhering to Elliott guidelines by avoiding overlap with Wave (i)’s territory, which preserves the impulsive nature. The final Wave (v) peaked with a bullish candle, signaling exhausted sellers and renewed energy. Analysts like those from Elliott Wave International note that such structures in altcoins often precede 15–25% extensions, especially with Litecoin’s historical correlation to Bitcoin at 0.85 per Pearson metrics from Messari.
If support at $100 falters, an alternate corrective scenario could unfold, targeting $85; however, current MACD crossovers remain positive, per TradingView indicators. This short-term setup complements the long-term triangle, enhancing the case for near-term gains.
Market Capitalization Trends and Weekend Projections
Litecoin’s 24-hour market capitalization has risen steadily from $7.4 billion to over $8.2 billion, driven by consistent capital inflows rather than sporadic spikes. Data from CoinMetrics illustrates this through realized cap metrics, showing long-term holders adding 5% to positions in the past month. Early trading sessions exhibited limited downside, with recoveries capping losses at 2%, establishing a resilient base.
Midday surges breached prior consolidation bands, pushing valuation into fresh territory amid balanced buy-sell ratios of 1.1:1 from Kaiko analytics. The asset’s late-session stability above session highs underscores participant confidence, with open interest on derivatives platforms like Deribit climbing 10% to $150 million. Currently trading above $100, LTC eyes $110 as a psychological barrier, particularly over the weekend when liquidity thins—historical patterns from 2023 weekends show 8% average volatility in similar setups.
Broader factors, including Litecoin’s Mimblewimble upgrade enhancing privacy features as noted in GitHub repositories, contribute to this outlook. Regulatory clarity from SEC filings on stablecoin integrations further supports adoption, per Deloitte blockchain reports. Traders should watch volume thresholds above 250 million for breakout confirmation.
Conclusion
In summary, Litecoin price resistance at the symmetrical triangle’s upper edge, combined with bullish Elliott Wave progression and a strengthening market cap, points to a compelling setup for gains toward $110. As LTC navigates this critical juncture, sustained inflows and technical validity from sources like Captain Faibik’s analysis reinforce the potential for upward resolution. Investors are advised to monitor key supports and volume shifts closely; with the crypto market’s 2025 momentum building, Litecoin could lead altcoin recoveries—position yourself for informed decisions ahead.
Comments
Other Articles
Bitwise Files for 11 Altcoin ETFs Including AAVE, UNI Amid SOL, XRP Muted Gains
December 31, 2025 at 08:47 PM UTC
Litecoin Consolidates Near $76 as Long-Term Ratio Suggests Potential Repricing Cycle
December 23, 2025 at 09:29 AM UTC
Litecoin’s Rising Hash Rate Signals Potential Upside Amid Key Support Challenges
December 12, 2025 at 01:02 AM UTC