MemeCore Plunges 30% Amid Memecoin Slump, Potential Bounce at Demand Zone
SOL/USDT
$2,730,174,497.21
$85.32 / $83.23
Change: $2.09 (2.51%)
+0.0015%
Longs pay

Contents
MemeCore, the infrastructure layer for memecoins, has seen a 30% price plunge amid a 5.6% broader memecoin market downturn, driven by bearish sentiment and negative funding rates. Investors are pulling liquidity as short traders dominate, though early signs of shifting optimism may signal a potential rebound in the demand zone.
-
MemeCore price drops 30% as memecoin sector weakens by 5.6%.
-
Bearish sentiment rises with negative OI-weighted funding rate at -0.4946%.
-
$11.1 million in new short capital inflows heighten downside risks, per CoinGlass data.
Discover why MemeCore is plummeting 30% in the struggling memecoin market. Explore bearish indicators, demand zones, and potential recovery signals for informed crypto investment decisions today.
What Is Causing the Recent MemeCore Price Decline?
MemeCore, a key infrastructure layer supporting memecoins, has experienced a sharp 30% price drop as the broader memecoin market contracts by 5.6%. This decline reflects widespread investor caution, with liquidity being withdrawn and short traders gaining control. At press time, according to CoinMarketCap, the token trades significantly lower, highlighting vulnerabilities in the sector.
How Is Bearish Sentiment Impacting MemeCore Liquidity?
The memecoin ecosystem’s ongoing struggles have amplified bearish pressures on MemeCore. Short traders have not only dominated trading volumes but also profited from their downside positions, as evidenced by market data. The open interest-weighted funding rate, a critical metric combining funding rates and open interest, has dipped to -0.4946%, signaling extreme bearishness where short positions prevail.
This negative rate indicates that most contracts are now held by those betting against price recovery, pulling liquidity from the market. Over the past 24 hours, $11.1 million in new capital has flowed into short positions, per CoinGlass analytics. Such dynamics often precede further corrections in volatile assets like MemeCore, underscoring the need for investors to monitor derivatives activity closely.
Despite this, subtle shifts are emerging. Community sentiment tracking shows optimism rising from below 32% to nearly 64% in a day, suggesting bullish influences may be gaining traction. This could temper the immediate downside, but sustained negative funding rates remain a headwind for price stabilization.

Source: CoinGlass
Frequently Asked Questions
What Factors Are Driving Investors to Remove MemeCore from Watchlists?
Investors are sidelining MemeCore due to the memecoin market’s 5.6% downturn and the token’s 30% plunge, as reported by CoinMarketCap. Bearish dominance in derivatives, marked by a -0.4946% funding rate, has eroded confidence, prompting liquidity withdrawals and focus on more stable assets in the crypto space.
Can MemeCore’s Demand Zone Prevent Further Price Drops?
Yes, MemeCore has entered a key demand zone, as shown on TradingView charts, where historical buy pressure often leads to rebounds. Bollinger Bands indicate proximity to the lower band, a bullish signal, though Parabolic SAR dots above the price suggest ongoing downward momentum that could test the $1 level if not reversed.
Key Takeaways
- Bearish Derivatives Dominance: Negative funding rates and $11.1 million in short inflows are fueling MemeCore’s 30% decline amid memecoin weakness.
- Potential Rebound Signals: Rising community sentiment to 64% and entry into a demand FVG zone could support a price bounce if bullish conviction strengthens.
- Monitor Retail and Technicals: With $40,000 in retail sales adding to pressure, watch Parabolic SAR and spot netflows for shifts in market direction.
Conclusion
MemeCore’s recent 30% price decline underscores the vulnerabilities in the memecoin infrastructure amid broader sector bearishness and negative funding rates. While demand zones and improving sentiment offer hope for recovery, persistent short dominance and technical indicators like Parabolic SAR point to risks of further drops toward $1. As the crypto market evolves, staying informed on derivatives data from sources like CoinGlass will be essential for navigating these trends—consider evaluating your portfolio’s exposure to similar assets today.
MemeCore Liquidity Pull
Bearish sentiment has intensified in the MemeCore market, with short traders not only leading activity but also capitalizing on declining prices. This is quantified through the open interest-weighted funding rate, which has reached -0.4946%, a level that typically reflects heavy short positioning and limited upside potential in the short term.
The influx of $11.1 million in new short capital over the last 24 hours has exacerbated liquidity concerns, drawing funds away from long positions. However, data from community sentiment trackers reveals a notable uptick in optimism, climbing from under 32% to almost 64%. This divergence between derivatives bearishness and growing retail positivity could foreshadow a sentiment pivot, though it remains too early to confirm a sustained reversal.
In the context of memecoins, such fluctuations are common, driven by the sector’s high volatility. MemeCore, as an enabling layer for these assets, is particularly sensitive to overall market health. Investors should note that while current metrics favor bears, historical patterns show that extreme negative funding often precedes corrections or bounces, depending on broader crypto trends.
Will M’s Demand Zone Hold?
MemeCore’s price action has brought it into a crucial demand zone, potentially setting the stage for a rebound. Technical analysis via Bollinger Bands places the token near the lower band, an area historically associated with increased buying interest and price recoveries in oversold conditions.
Complementing this is a demand Fair Value Gap (FVG) zone, where unmatched buy orders accumulate, providing natural support. On TradingView charts, this alignment suggests underlying strength, even as the asset faces immediate pressures.
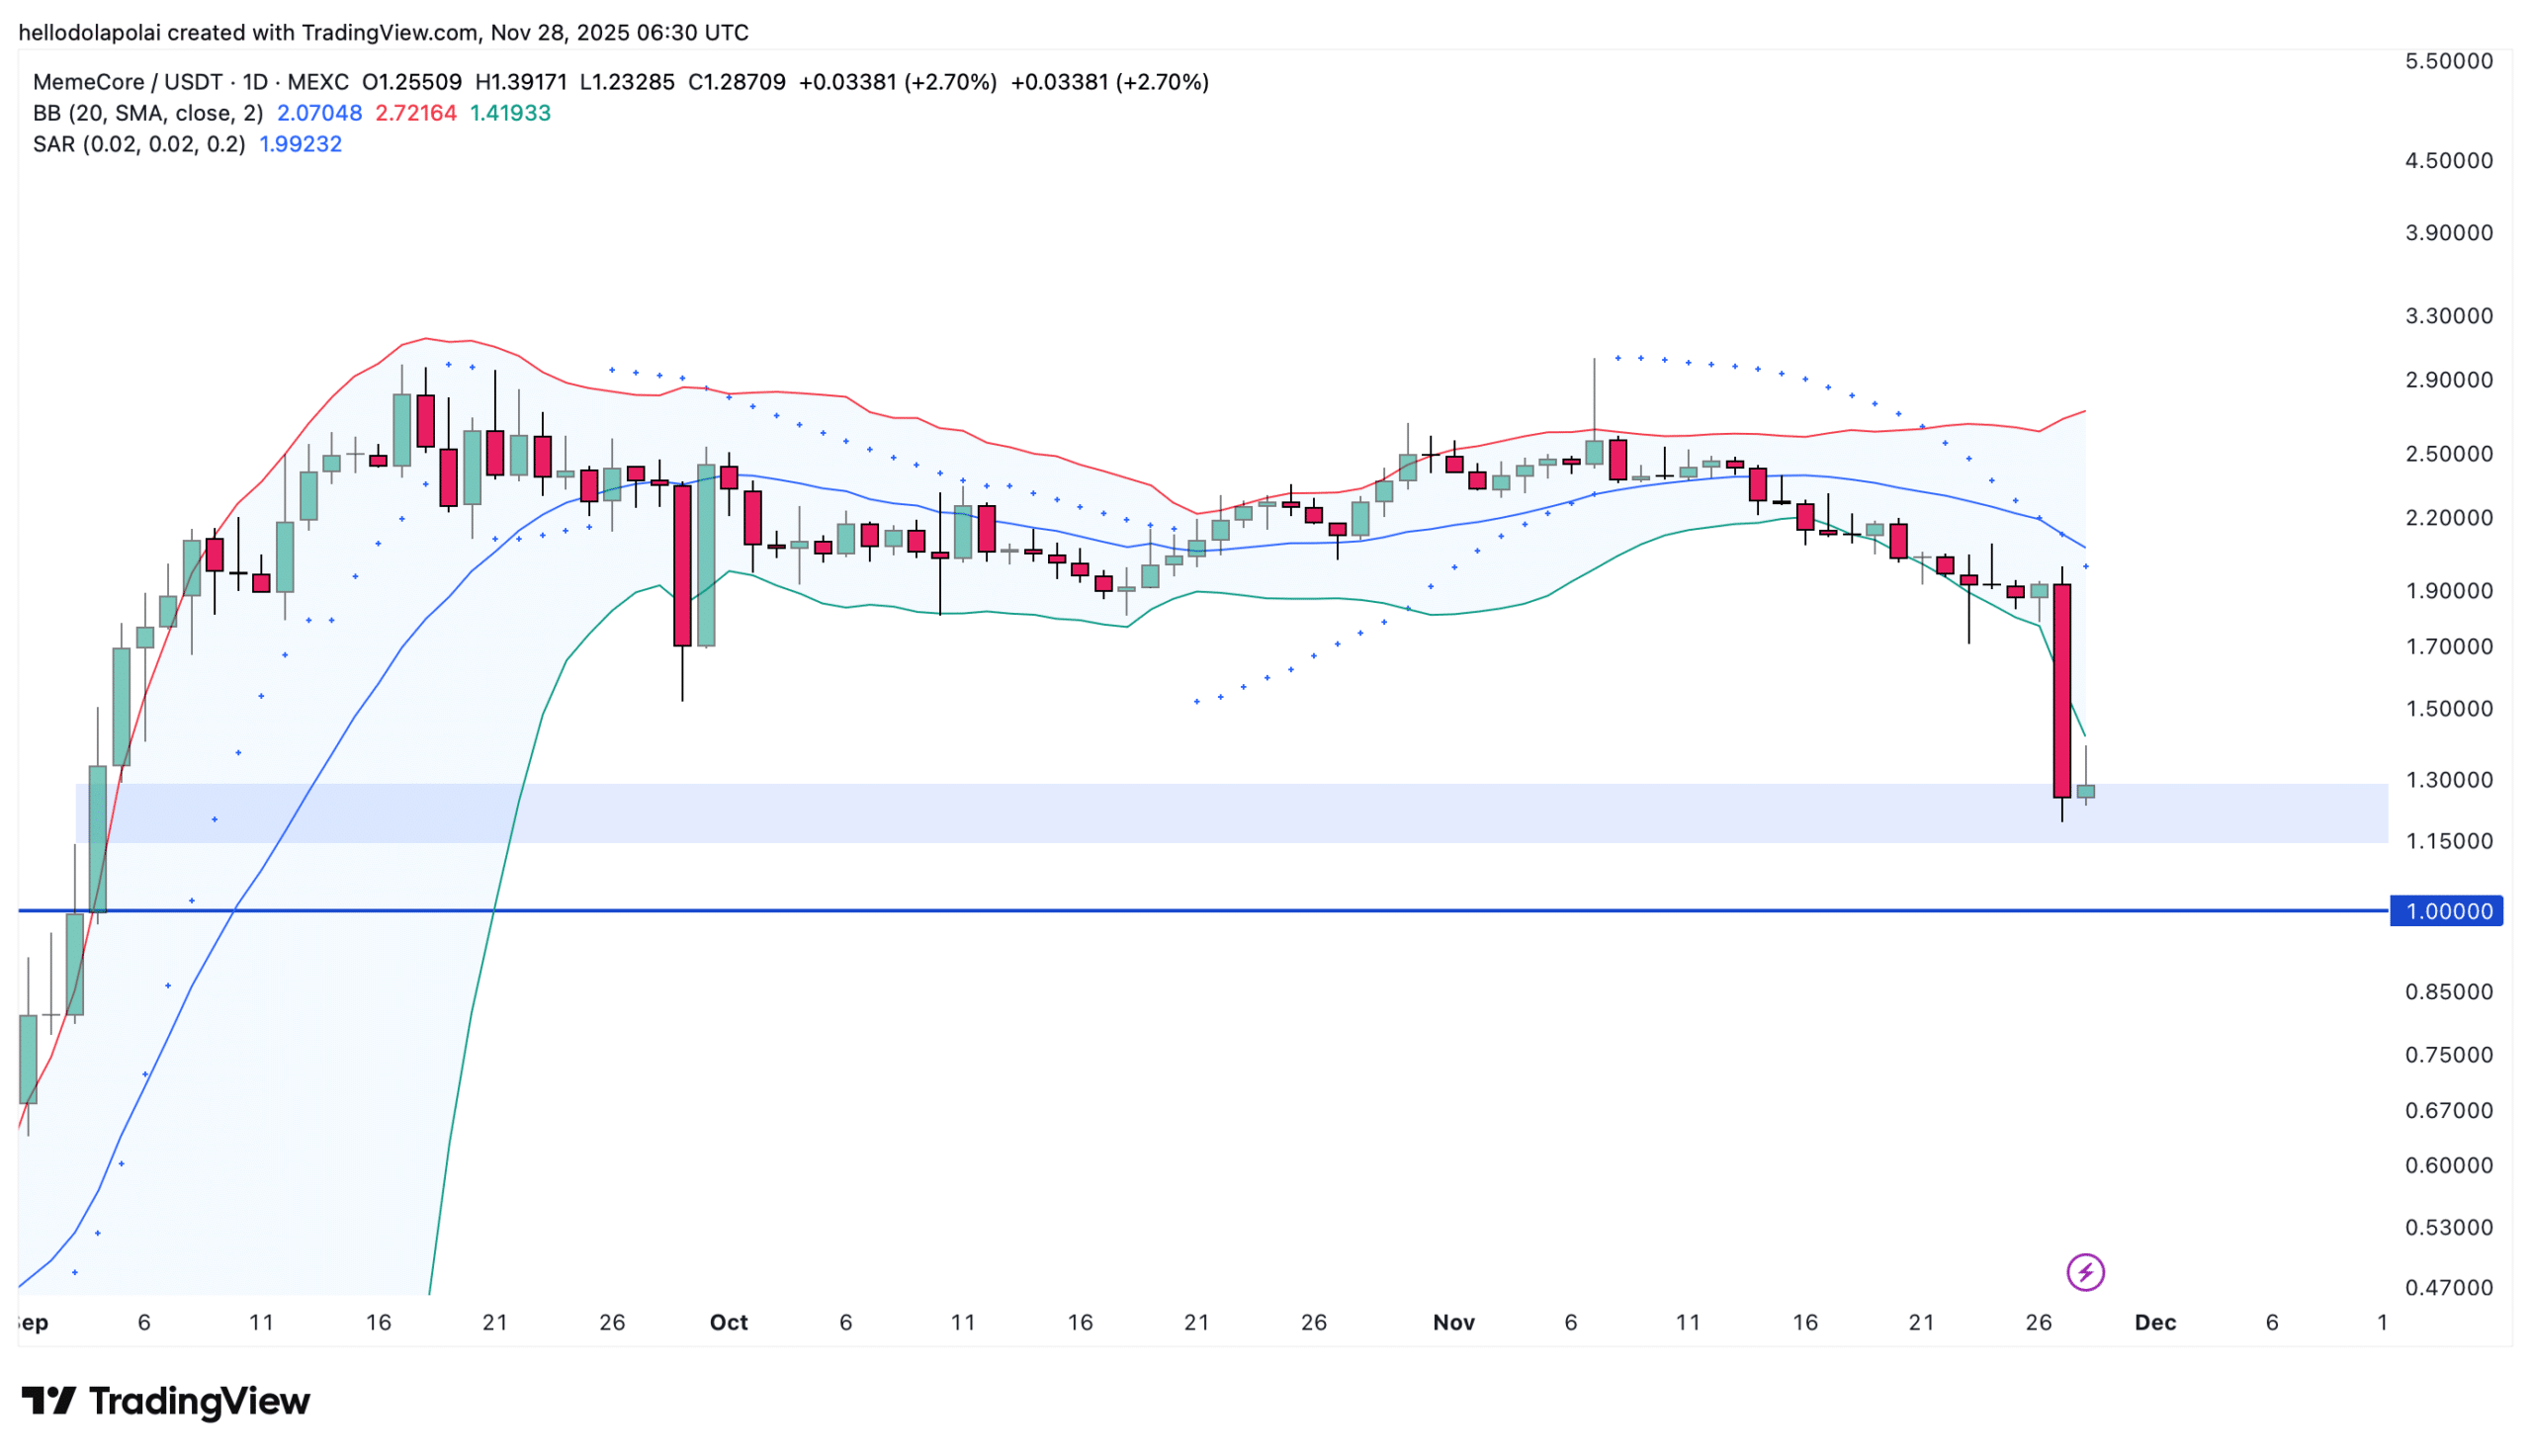
Source: TradingView
That said, confirmation from the Parabolic Stop and Reverse (SAR) indicator is lacking. With SAR dots positioned above the current price, the trend remains bearish, potentially driving MemeCore toward the $1 support level. This technical standoff illustrates the balance between support structures and momentum indicators in dictating near-term movements.
For context, demand zones in crypto trading represent price levels where buyers have previously stepped in aggressively, often leading to rallies. In MemeCore’s case, if volume picks up at this level, it could invalidate the bearish SAR setup. Conversely, a break below might accelerate selling, emphasizing the importance of real-time monitoring.
Odds Stacking Up
Downside risks for MemeCore are mounting, fueled by retail investor selling amid a total spot market volume of $40.15 million. Retail contributions to this volume total around $40,000 in sales, a modest figure compared to derivatives but indicative of waning spot demand.
This retail activity reinforces the control exerted by derivatives traders, who dictate much of the price direction through leveraged positions. As long as bearish sentiment persists among this dominant group, additional declines are probable, with netflows showing outflows that compound the pressure.

Source: CoinGlass
Such patterns are not uncommon in crypto, where spot and futures markets often diverge before converging. For MemeCore, the current setup tilts toward continued bearish momentum until a clear catalyst—like positive sector news or funding rate normalization—emerges to shift the balance.
Overall, the interplay of these factors positions MemeCore at a pivotal juncture. The token’s role in memecoin infrastructure makes it intertwined with speculative trends, but technical supports provide a buffer against deeper losses. Investors tracking similar assets should weigh these indicators against global crypto sentiment for balanced decision-making.
Related Tags
Comments
Other Articles
Solana Shows Potential Bullish Breakout with Growing Institutional ETP Assets
December 17, 2025 at 08:36 AM UTC
Binance Leveraged Delists DOT/FDUSD and 14 Other FDUSD Leverage Trading Pairs on Dec 23, 2025
December 16, 2025 at 05:04 AM UTC
Cointelegraph’s CTDG Dev Hub Aims to Enhance Blockchain Transparency for Solana and Beyond
November 25, 2025 at 02:36 PM UTC