ORCA’s 25% Drop Sparks Volatility: Potential Rebound from Wedge Retest
OP/USDT
$18,889,690.62
$0.1063 / $0.1020
Change: $0.004300 (4.22%)
+0.0020%
Longs pay

Contents
The ORCA price experienced a sharp 25% decline to $1.32 amid an 856% surge in trading volume and a 69.22% increase in open interest, signaling heightened market volatility and speculative activity in the ORCA cryptocurrency.
-
ORCA price retests key support: After breaking out of a multi-month descending wedge, the current dip to $1.22–$1.04 levels is acting as a retest, with buyers showing strength near these zones.
-
Taker Buy CVD indicates persistent buyer interest, rising steadily over 90 days despite the price drop, which suggests underlying demand in the ORCA market.
-
Long-short ratio at 50.49% favors longs slightly, with open interest jumping 69.22%, reflecting cautious optimism and potential for a rebound in ORCA price.
Discover why ORCA price plunged 25% to $1.32 with surging volume and open interest. Analyze charts and metrics for insights on potential recovery. Stay updated on ORCA cryptocurrency trends today.
What Caused the Recent ORCA Price Decline?
ORCA price fell 25% to $1.32 due to intense selling pressure combined with a massive 856% increase in trading volume and a 69.22% rise in open interest. This volatility reflects aggressive leverage and rapid market reactions in the ORCA cryptocurrency ecosystem. Buyers, however, have historically stepped in near the $1.22–$1.04 support zone, potentially stabilizing the price if demand persists.
How Does Trading Volume Affect ORCA Price Movements?
The surge in trading volume for ORCA highlights amplified market participation, widening intraday price ranges and forcing quick adjustments from traders. Data from TradingView shows ORCA reacting sharply to order flows, with the recent breakout from a descending wedge now under retest. According to CryptoQuant metrics, taker buy cumulative volume delta (CVD) has trended upward over 90 days, indicating consistent buyer absorption even during declines. This pattern, observed in spot markets, underscores active demand that could counteract selling pressure. Experts note that such volume spikes often precede rebounds when support holds, as seen in ORCA’s wick formations near key levels. Short sentences for clarity: Volume drives liquidity. Liquidity fuels volatility. Volatility tests resolve at support.
ORCA already broke out of its multi-month descending wedge, and the current decline now acts as a retest rather than a rejection. The chart shows a strong breakout candle that pushed above the wedge boundary before sellers drove the price back toward the retest zone near $1.22–$1.04. This retest creates a critical moment because buyers responded quickly the last time the price touched this region. ORCA must reclaim $1.57 to unlock momentum toward $2.07, $2.49, and $3.00. Meanwhile, the MACD momentum also improves as histogram bars rise, which supports the rebound structure. However, the pullback demands strong buyer follow-through to preserve the breakout. Furthermore, the sharp wick near support signals aggressive liquidity absorption during the decline.
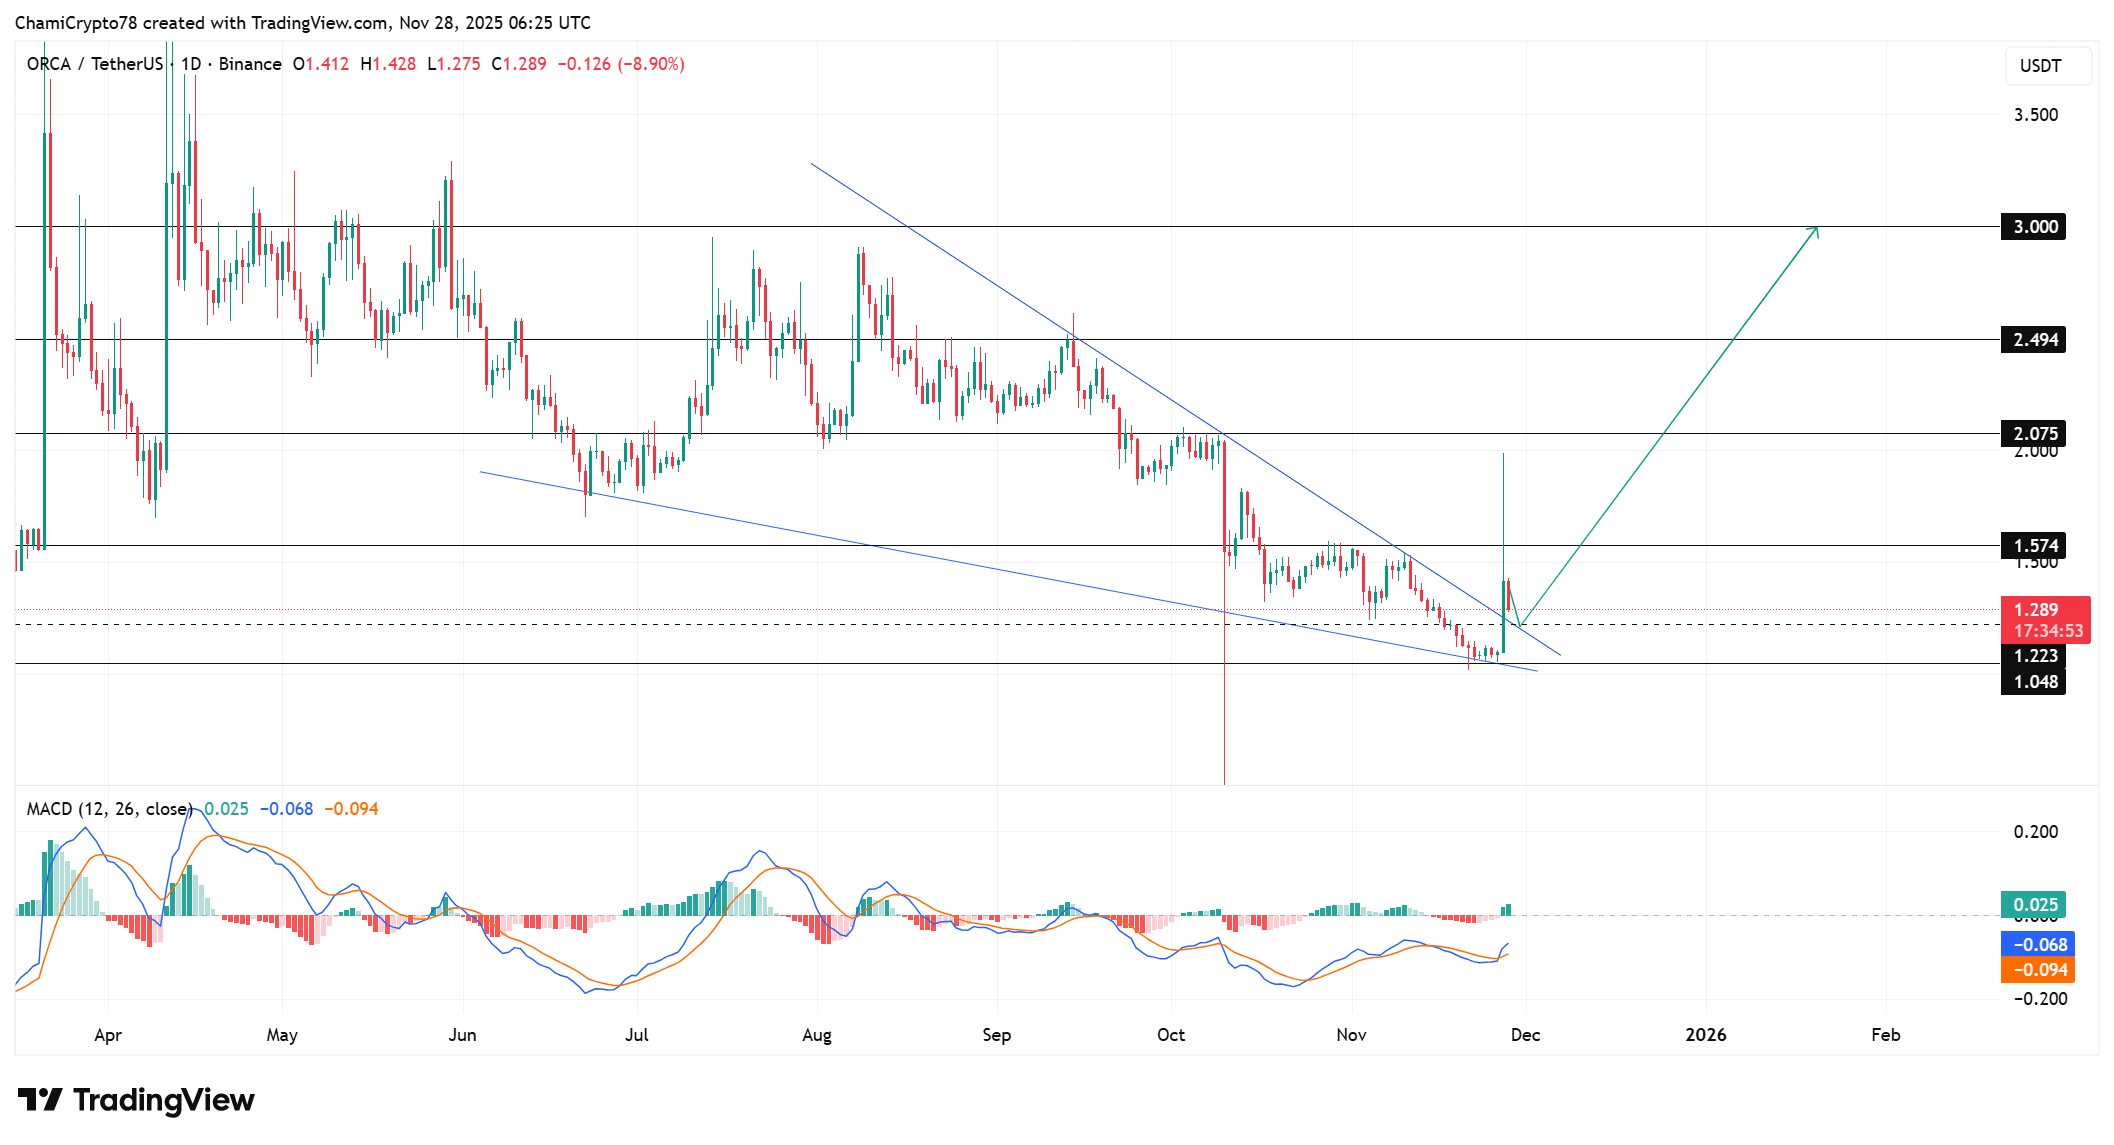
Source: TradingView
Taker Buy CVD shows persistent buyer strength, and this metric continues to rise despite ORCA’s sharp decline. Market takers lift sell orders aggressively, and this behavior increases confidence in a possible rebound from the wedge floor. Moreover, the 90-day trend shows consistent upward movement, which matches repeated buy reactions near support. However, the steep drop increases volatility and forces buyers to adjust quickly. ORCA responds strongly to every burst of sell-side pressure, which creates sharp but controlled movements. The CVD slope confirms active demand because buyers continue absorbing liquidity during the heaviest periods. Furthermore, this pattern strengthens the broader structure and increases the chances of a sustained rebound as long as buyer execution remains strong.
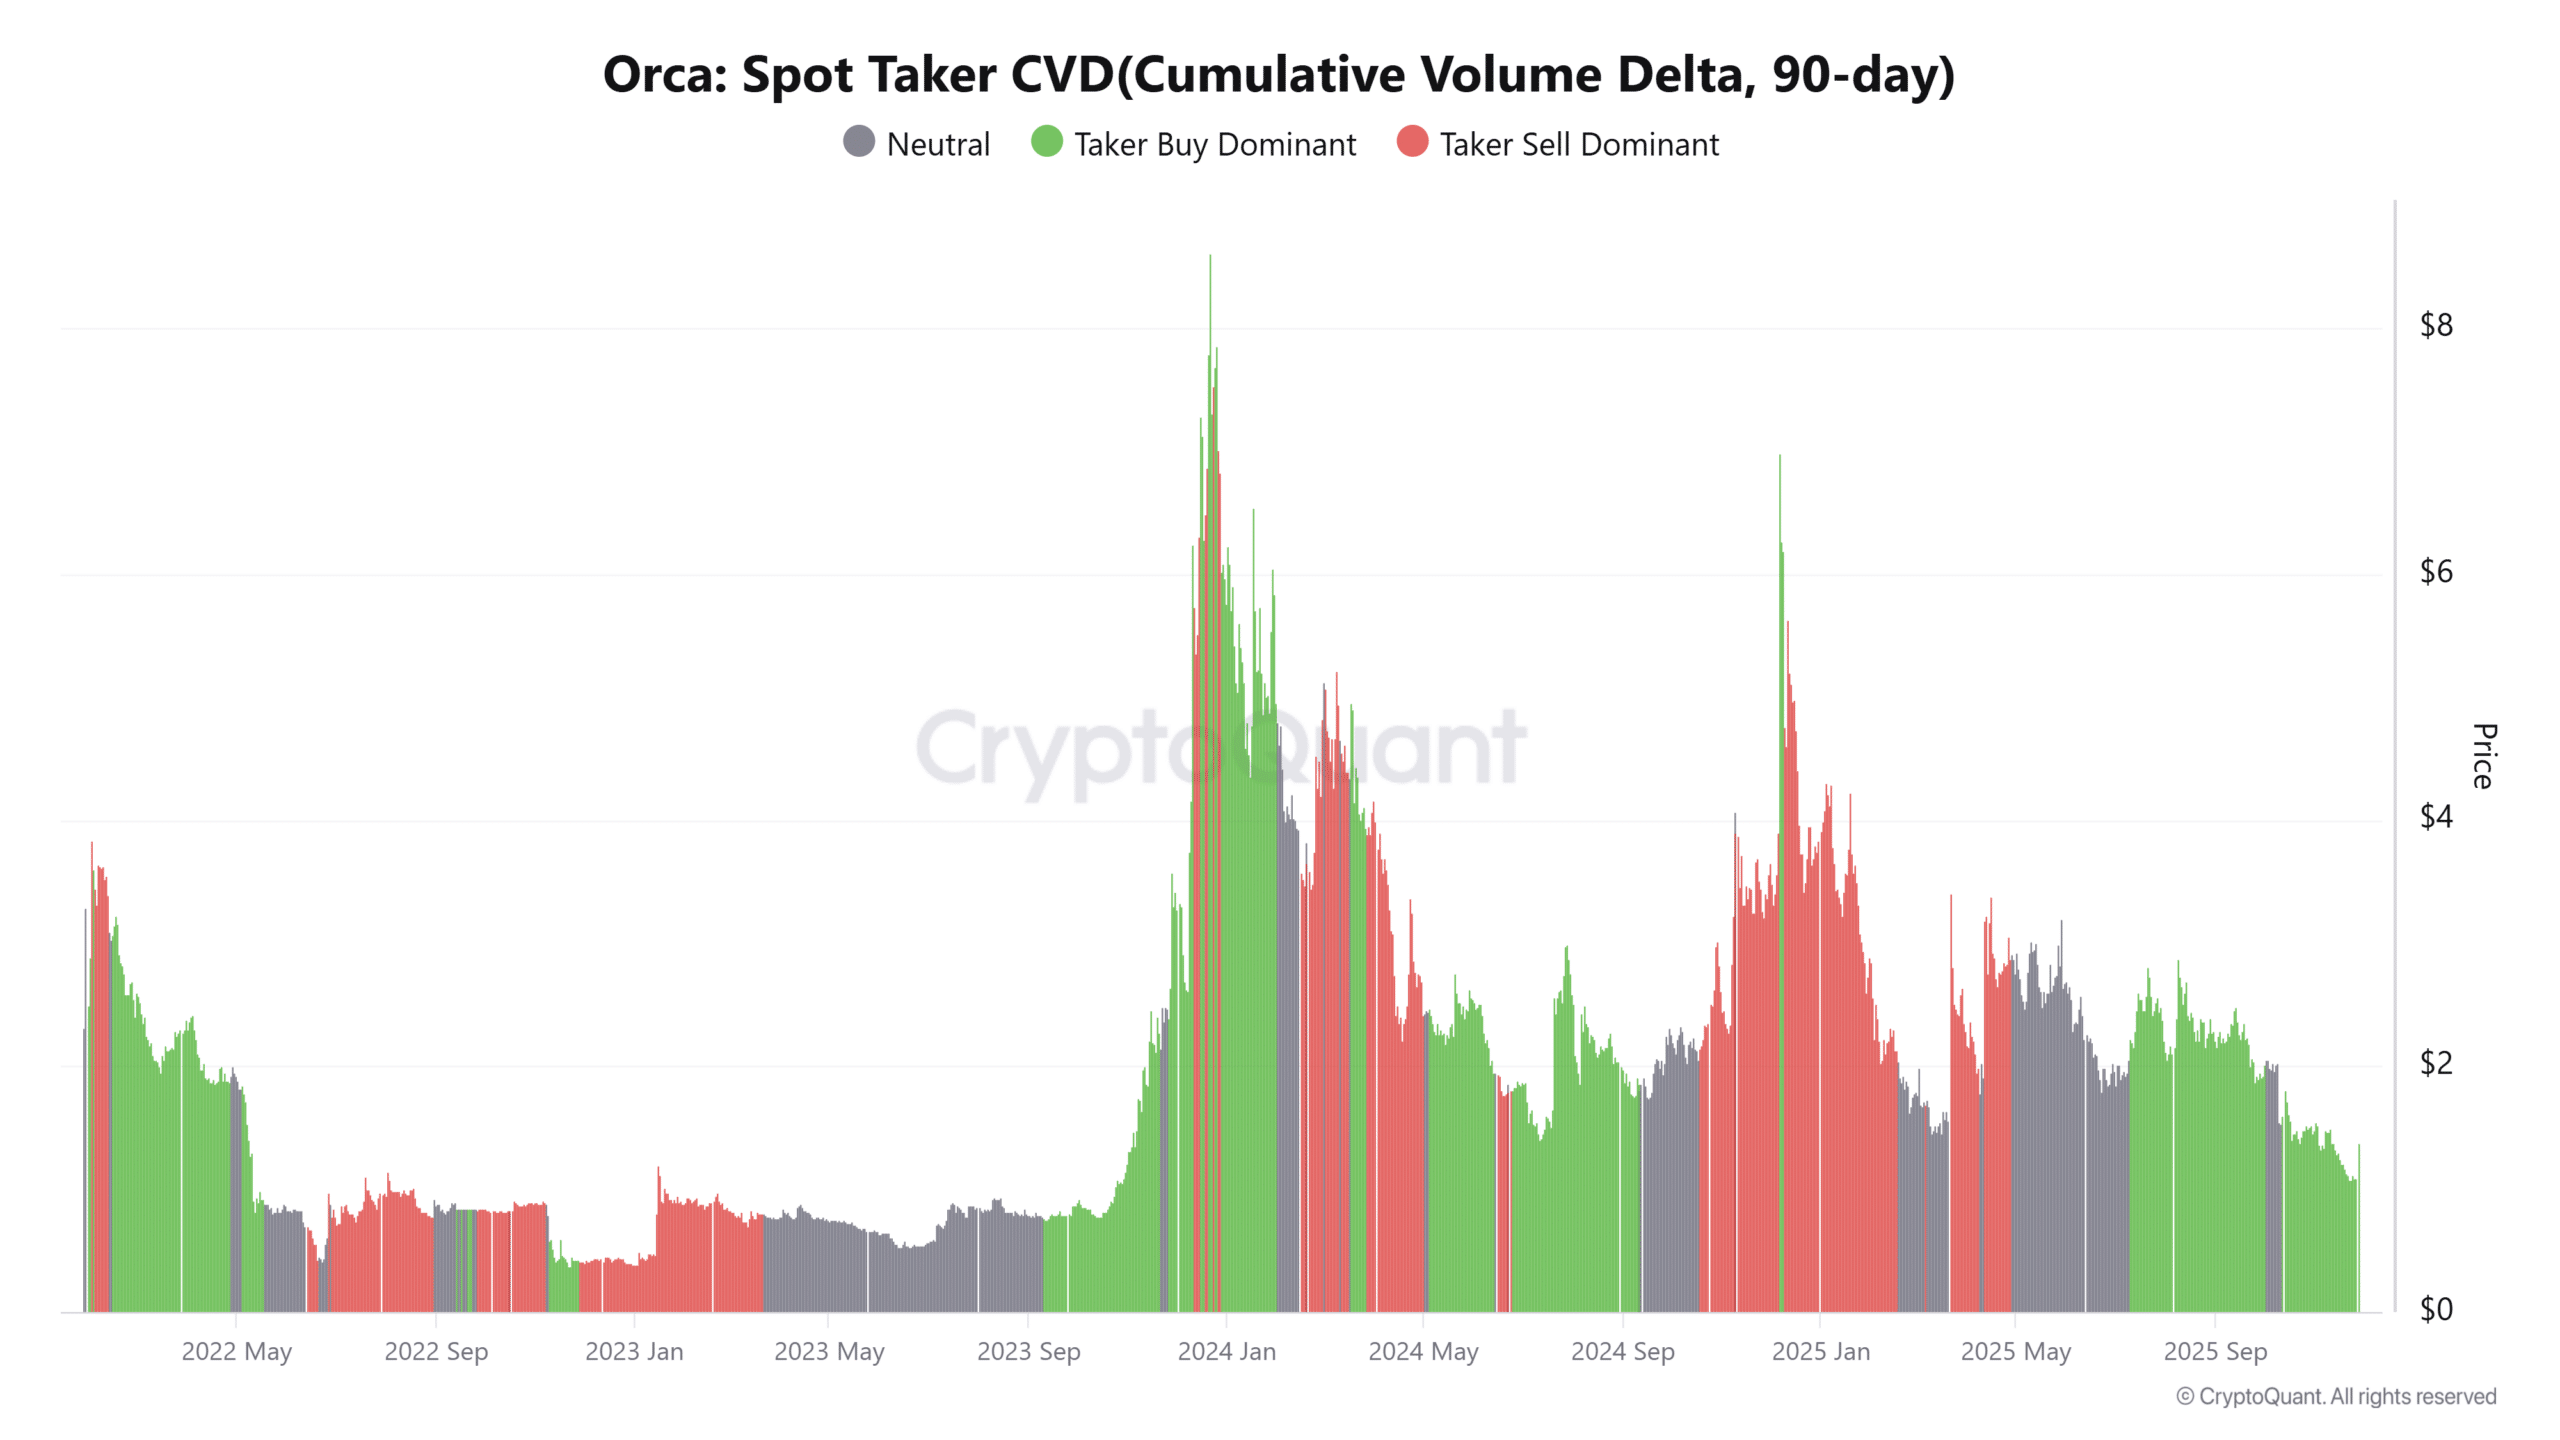
Source: CryptoQuant
At press time, the Long/Short Ratio sat at 50.49% long and 49.51% short, which shows a slight bullish preference even after the large daily decline. This near-even split reveals caution, yet long traders continue building exposure during the drop. Moreover, the ratio line shows several upward swings that match demand reactions on the wedge floor. However, shorts still attempt quick pushes when volatility rises, and this creates sharp intraday battles. Buyers reclaim control frequently because their reactions appear faster and more coordinated. ORCA benefits from this balance because liquidity builds on both sides and increases the potential for a strong move. Furthermore, the slight long bias supports the bullish structure and aligns with the strong CVD trend.
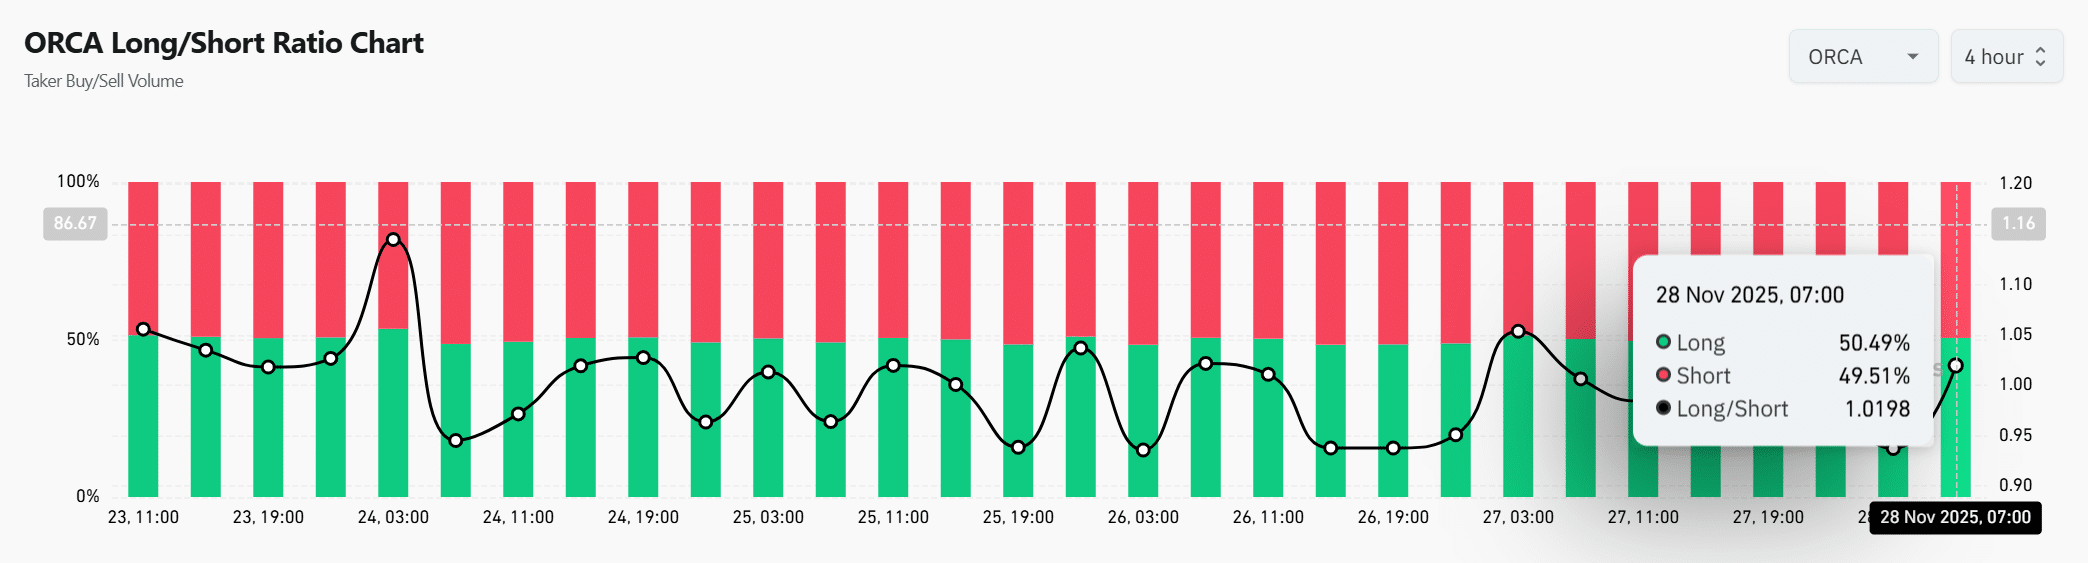
Source: CoinGlass
ORCA now trades at a decisive level because the price dropped sharply while deeper metrics strengthened. Volume, Open Interest, CVD flow, and long positioning all increased during the decline, and this behavior shows confidence rather than panic. ORCA must hold the wedge floor to regain momentum. If buyers maintain control, the setup supports a rebound toward higher resistance levels with stronger conviction. The ORCA cryptocurrency’s resilience is evident in these indicators, as historical data from platforms like TradingView and CryptoQuant reveal patterns where volume surges lead to stabilization when support aligns with buyer metrics.
Frequently Asked Questions
What is the current support level for ORCA price after the 25% drop?
The key support for ORCA price lies between $1.22 and $1.04, where buyers have previously absorbed selling pressure. This zone, identified through chart analysis on TradingView, has triggered rebounds in past sessions, making it crucial for maintaining the bullish wedge breakout structure.
Why did ORCA trading volume increase by 856% recently?
The 856% surge in ORCA trading volume stems from heightened speculative activity and leverage usage amid the price volatility. As reported by market data from CryptoQuant, this influx reflects aggressive trader participation, often seen during breakouts or retests, enhancing liquidity but also amplifying short-term swings in the ORCA cryptocurrency market.
Key Takeaways
- Buyer Strength Persists: Taker Buy CVD rising over 90 days signals ongoing demand, even as ORCA price declines, per CryptoQuant data.
- Support Retest Critical: The $1.22–$1.04 zone acts as a wedge floor, with historical buyer reactions supporting potential stabilization.
- Bullish Bias Intact: A 50.49% long ratio from CoinGlass indicates cautious optimism, urging traders to monitor for rebound signals above $1.57.
Conclusion
The ORCA price decline of 25% to $1.32, driven by surging trading volume and open interest, underscores the volatile yet resilient nature of the ORCA cryptocurrency market. Key metrics like taker buy CVD and long-short ratios point to underlying buyer confidence near support levels. As the asset retests its breakout zone, holding these levels could pave the way for upward momentum toward $2.07 and beyond—traders should watch closely for sustained buying activity in the coming sessions.