SEI Holds Channel Floor, Signaling Potential Upside to $0.25-$0.36
SEI/USDT
$46,592,643.60
$0.0703 / $0.0675
Change: $0.002800 (4.15%)
-0.0023%
Shorts pay

Contents
SEI cryptocurrency maintains its position at the channel floor, with active buyer demand supporting potential upward moves toward $0.25 and $0.36. Analysts highlight a descending channel structure, where holding key support could trigger rebounds from the $0.10–$0.15 demand zone, fostering long-term growth.
-
SEI holds its channel floor as buyers stay active near the demand zone, supporting upward potential.
-
Analysts track a descending channel with targets at $0.20, $0.25, and $0.36 if support holds.
-
Long-term structure shows rebounds in the $0.10–$0.15 zone and a trendline break toward higher ranges, backed by market data from Coingecko indicating a $950 million market cap.
Discover SEI’s channel floor hold and potential surge to $0.25–$0.36. Analyze demand zones and analyst insights for informed crypto trading decisions today.
What is the Current Price Outlook for SEI Cryptocurrency?
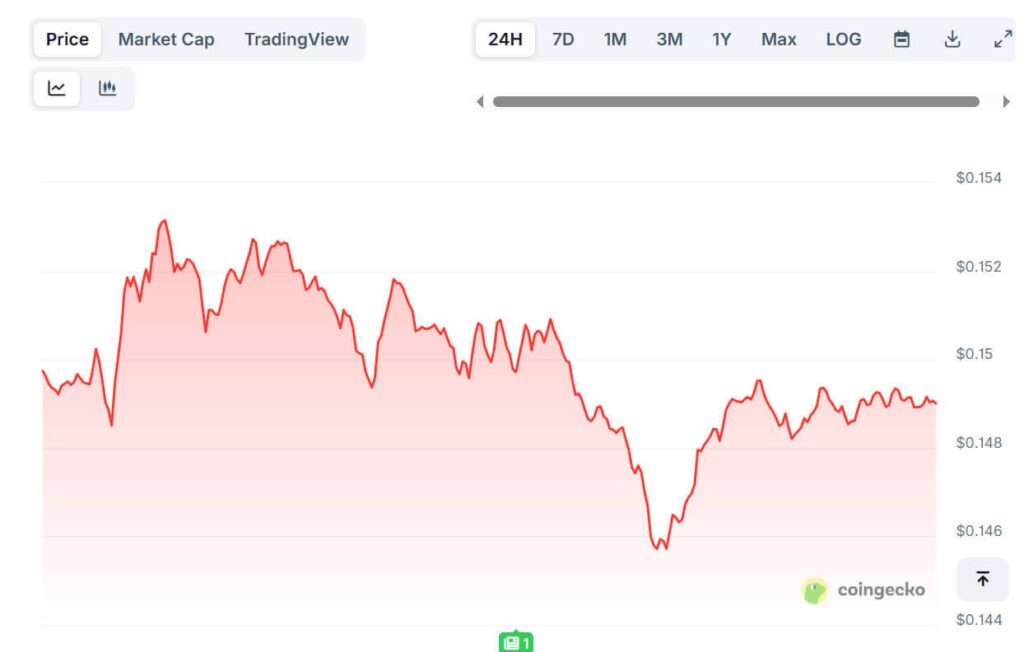
SEI cryptocurrency is currently trading near its long-term channel floor around $0.149 to $0.157, showing steady buyer activity that could propel prices toward $0.25 or even $0.36 if support levels hold. Market data from Coingecko reveals a market capitalization of approximately $950 million and a 24-hour trading volume exceeding $99 million, underscoring resilient demand in the $0.10–$0.15 zone. This positioning within a descending channel suggests potential for upward momentum upon a successful rebound.
Recent trading sessions have demonstrated controlled intraday swings, with the price testing lows near $0.1457 before recovering to $0.153. Higher lows in the chart patterns indicate building support, while the fully diluted valuation stands at about $1.49 billion. Analysts, including those from Ali Charts, emphasize the importance of maintaining this floor to avoid deeper corrections and enable progression through key resistance levels.
Source: Coingecko
Bouncing off the channel’s bottom could send $SEI toward the mid-range at $0.25 or even the top at $0.36. pic.twitter.com/S6gE4fSSZo
— Ali (@ali_charts) November 18, 2025
How Does the Descending Channel Influence SEI’s Trading Patterns?
The descending channel for SEI cryptocurrency originated in early October, following a consolidation period between $0.26 and $0.30, and continues to guide price action with clear boundaries. If the current support near $0.146 holds, projections from analysts like Ali Charts point to incremental targets at $0.20 and $0.24, potentially extending to $0.25 and $0.36 upon a decisive breakout. This structure has led to orderly fluctuations, with repeated tests of the lower boundary resulting in higher lows, as evidenced by Coingecko’s volume data showing sustained interest above $99 million daily.
Historical volatility within this channel provides a robust framework for traders, where buyer interventions in the demand zone have historically triggered rebounds. Expert observations note that a trendline break from this compression could shift market dynamics toward broader upward activity, aligning with long-term patterns observed since SEI’s earlier peaks. Data underscores the channel’s role in containing downside risks while highlighting opportunities for gains, with the price’s proximity to the floor signaling potential momentum buildup.
Frequently Asked Questions
What Factors Are Driving SEI’s Potential Rebound from the $0.10–$0.15 Zone?
SEI’s potential rebound from the $0.10–$0.15 demand zone is primarily driven by consistent buyer activity and historical support levels, as seen in multiple recoveries documented in market charts. Analysts like LLuciano_BTC highlight how this zone has acted as a reliable floor, with trading volume from Coingecko confirming over $99 million in daily activity that bolsters these efforts. Holding this level could facilitate a move toward $0.25, reinforcing the token’s structural integrity.
Can SEI Reach $0.36 in the Near Term Based on Current Channel Analysis?
Yes, SEI could reach $0.36 in the near term if it successfully bounces from the channel floor and breaks key trendlines, according to observations from trading experts. The descending channel’s upper boundary aligns with this target, supported by steady demand and a market cap of $950 million as reported by Coingecko. This scenario depends on maintaining support above $0.145, allowing for natural progression through resistance levels in a structured market environment.
Key Takeaways
- Strong Support at Channel Floor: SEI’s hold above $0.145 demonstrates resilient buyer demand, setting the stage for potential upward trajectories.
- Descending Channel Targets: Key levels at $0.20, $0.25, and $0.36 offer clear milestones, backed by historical rebounds and current volume data.
- Long-Term Demand Zone: Activity in the $0.10–$0.15 area signals opportunities for investors to monitor trendline breaks for entry points.
Conclusion
In summary, SEI cryptocurrency exhibits promising stability at its descending channel floor, with the $0.10–$0.15 demand zone providing a solid foundation for potential advances toward $0.25 and $0.36. Insights from sources like Coingecko and analysts such as Ali Charts and LLuciano_BTC underscore the token’s structured market behavior and buyer resilience. As trading volume remains robust, investors should watch for confirmation of support holds to capitalize on emerging opportunities in this dynamic crypto landscape.
SEI Shows Steady Activity Near the Lower Boundary
Recent data shows SEI trading between $0.149 and $0.157, while intraday swings remain controlled. The 24-hour range stays between $0.1457 and $0.1531, and the chart shows early softness before an upswing toward $0.153.
Data from Coingecko lists a market cap of $950 million, and a fully diluted valuation near $1.49 billion, with trading volume above $99 million. The short-term chart shows repeated tests near $0.146, and these tests lead to moves toward $0.15. The waves form higher lows during later sessions, and the fluctuations remain orderly.
According to analysis prepared by Ali Charts, SEI continues to track a descending channel formed in early October, with previous consolidation between $0.26 and $0.30 serving as a key reference. Projected paths show movement toward $0.20 and $0.24 if current support holds.
Long-Term Structure Shows Activity Near the Demand Zone
According to an observation by LLuciano_BTC, SEI continues to move inside a broad downward structure that began after its earlier peak. The price reached the $0.10–$0.15 demand zone, where buyers formed several rebounds. A trendline break forms near the top of the zone, and this change marks a shift from compression into wider activity.
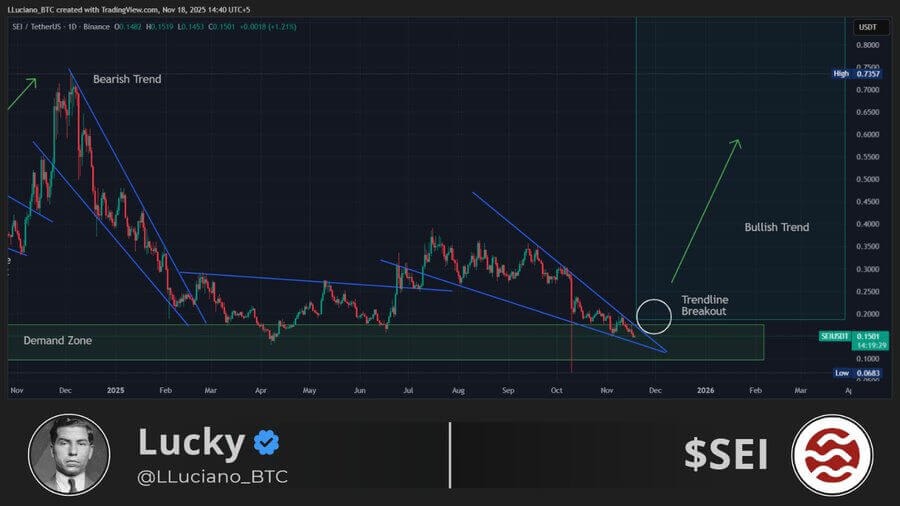
Source: LLuciano_BTC(X)
Historical readings show wide volatility during earlier phases, creating a detailed backdrop for current movement. The long-term channel offers clear boundaries, and traders continue to track reactions near its lower limit.
The chart also shows repeated movements inside this channel, giving structure to current market behavior. Analysts note that a continued hold above the channel floor aligns with the projected path toward $0.25 or $0.36, which remain visible targets based on historical movement and present structure.
Comments
Other Articles
SEI Consolidates Near $0.10 Support as TVL Recovers, Downside Risk Looms
December 30, 2025 at 04:16 AM UTC
SEI Price Dips to Vulnerable Zone as Traders Increase Derivatives Exposure
December 20, 2025 at 08:08 PM UTC
MetaMask Adds Bitcoin Support, Boosting Multichain Wallet Features
December 16, 2025 at 05:01 AM UTC