

SOL Treasury Companies $1.5 Billion in Losses
SOL/USDT
$1,171,132,088.42
$74.33 / $71.98
Change: $2.35 (3.26%)
-0.0005%
Shorts pay

Record Losses in SOL Treasury Assets
Publicly traded companies holding Solana as a treasury asset are recording over $1.5 billion in unrealized losses based on CoinGecko's purchase costs and the current $84.12 market price. These losses are concentrated in a few US-based companies controlling a total of over 12 million SOL tokens (2% of supply). Forward Industries, Sharps Technology, DeFi Development Corp, and Upexi are the main sources of losses exceeding $1.4 billion; the figure is likely understated since Solana Company's full costs are kept secret.
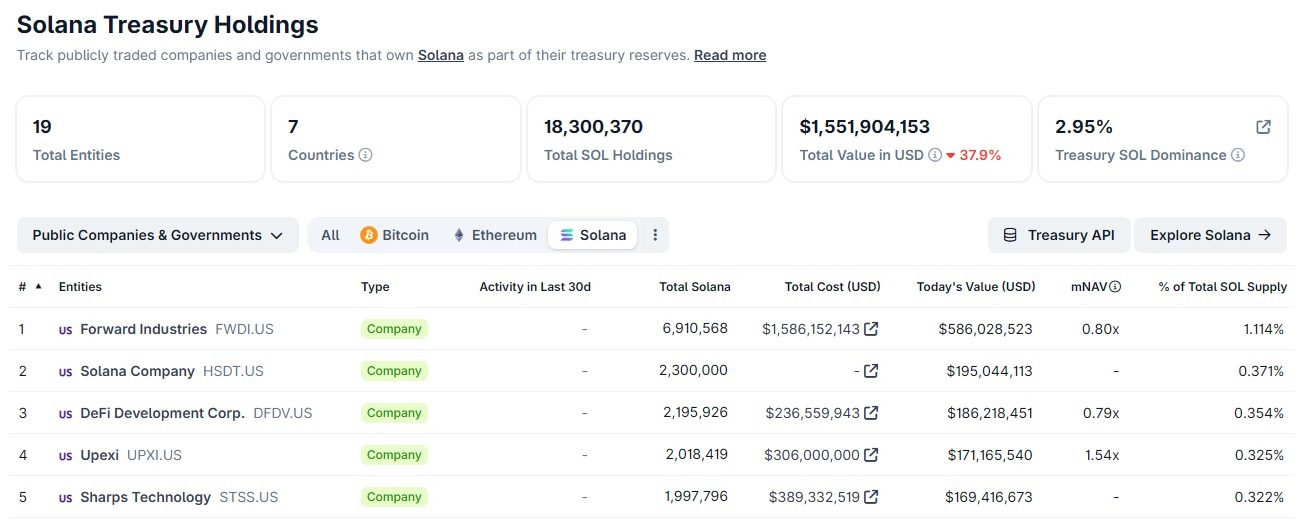
Top five Solana treasury companies. Source: CoinGecko
Purchase Details of the Largest SOL Holders
CoinGecko data shows that SOL accumulations were concentrated in July-October 2025. None of the top five companies have made new purchases or on-chain sales. Here is the detailed table:
| Company | SOL Amount | Avg. Purchase Price | Unrealized Loss |
|---|---|---|---|
| Forward Industries | 6,9M | $230 | $1B+ |
| Sharps Technology | - | - | $220M (56% loss) |
| Others | - | - | $200M+ |
Company Stock Performance and Capital Issues
Forward Industries' 6-month stock chart (Google Finance) shows an 80% value loss. Sharps Technology declined 59%. Their performance worse than SOL ($84.12, +0.53% 24h) limits their capital-raising abilities. Click for detailed SOL analysis.
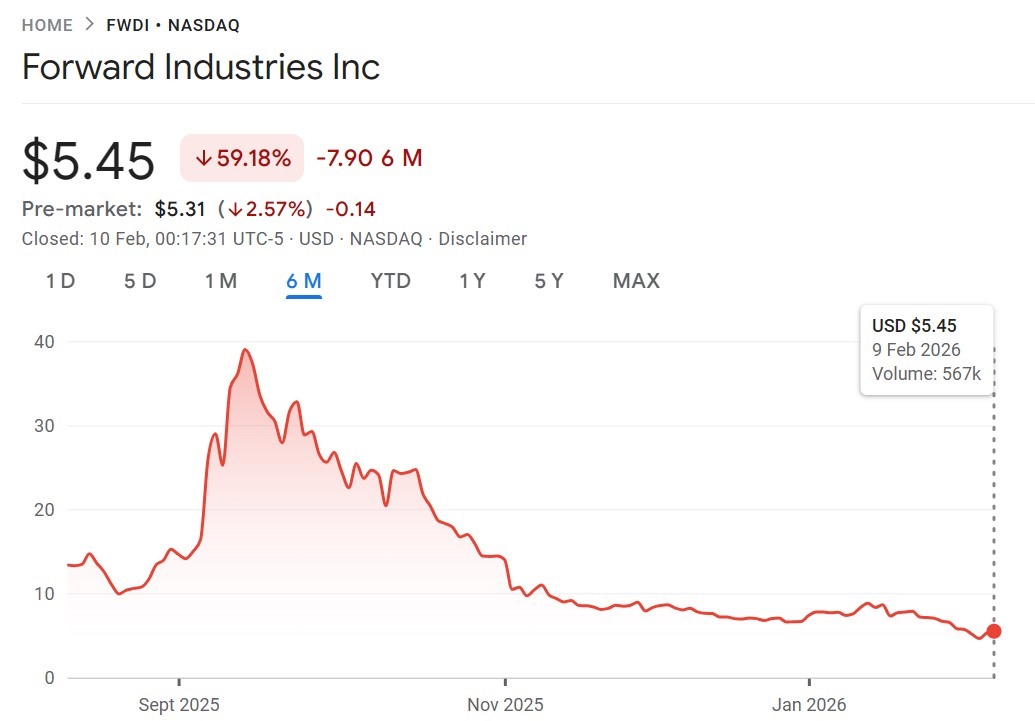
Forward Industries 6-month chart. Source: Google Finance
SOL Technical Analysis: Oversold Region
SOL in downtrend, RSI 27.95 (oversold). Supertrend bearish, below EMA20 $102.67. Strong supports:
- S1: $81.35 (78/100 ⭐, -3% distance)
- S2: $71.77 (72/100 ⭐, -14%)
Resistances: R1 $96.20 (69/100 ⭐, +14%), R2 $88.72 (+5.8%). Monitor SOL futures opportunities.
| Level | Price | Score | Distance |
|---|---|---|---|
| S1 | $81.35 | 78/100 | -3% |
| R1 | $96.20 | 69/100 | +14% |
ETF Flows and Market Context
February 9, 2026 ETF flows: BTC +$144.9M, ETH +$57M net inflows (February 10 current). Without a SOL ETF, institutional treasury accumulations are under pressure. These losses may affect SOL's recovery potential.
Investor Risks and Strategy Recommendations
These companies' limited liquidity may create SOL selling pressure. Although the RSI oversold signal offers a buying opportunity, be cautious in the downtrend. For long-term holders, follow SOL spot analysis.
COINOTAG does not provide financial advisory services. This content is for informational purposes only and should not be considered investment advice. Cryptocurrency investments involve high risk.
Add COINOTAG as a Preferred Source
Add COINOTAG to your preferred sources in Google News and Search to see our coverage first.
Add on GoogleRelated Tags
AI-generated, AI-reviewed, under COINOTAG editorial oversight.