Solana Exhibits Early Bullish Structure Post Falling Wedge Breakout
SOL/USDT
$5,224,756,324.54
$97.68 / $91.27
Change: $6.41 (7.02%)
+0.0007%
Longs pay

Contents
Solana price analysis indicates a bullish breakout from a falling wedge pattern, shifting derivatives positioning toward options activity, with long liquidations signaling a leverage reset. Current price hovers near $132.67 amid limited volume confirmation, targeting resistance at $140 for further upside.
-
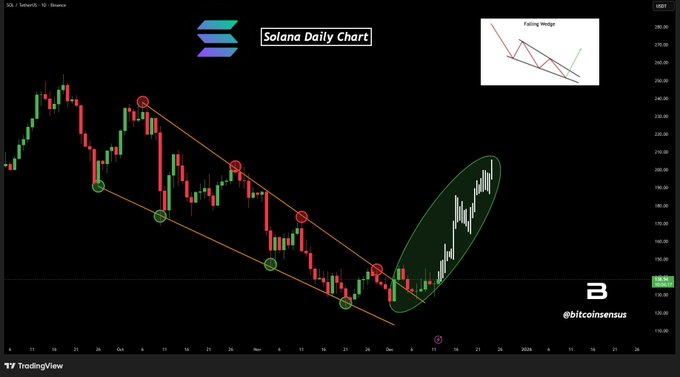
Solana’s falling wedge breakout on the daily chart signals early bullish reversal, though volume remains subdued for full confirmation.
-
Derivatives show futures volume declining 6.86% to $14.12B, while options volume surged 209.78% to $198.58M open interest.
-
Long liquidations have dominated recent sessions, reflecting a market reset rather than sustained bearish momentum, with $4.94B spot volume.
Solana price analysis reveals breakout potential amid shifting derivatives trends. Explore key resistance at $140 and implications for 2025 crypto markets in this detailed review.
What is the Current Solana Price Analysis Indicating?
Solana price analysis highlights an emerging bullish structure following a breakout from a prolonged falling wedge pattern on the daily chart, suggesting diminishing seller control and potential for higher lows. While futures activity cools, options participation has spiked, indicating traders are positioning for volatility rather than high leverage. This transition phase requires volume confirmation above $140 to solidify upward momentum, as current trading at $132.67 reflects measured caution after a 4.58% daily decline.
What Does the Falling Wedge Breakout Mean for Solana’s Technical Structure?
Solana’s technical setup has shifted positively with the confirmed breakout from a falling wedge that developed over an extended corrective period. This pattern, characterized by converging trendlines with lower highs and higher lows, typically signals exhaustion of bearish pressure as downside attempts weaken progressively. Market data from TradingView and CoinMarketCap corroborates this, showing successive lows failing to breach prior supports, which eroded seller conviction.
Post-breakout, price action has focused on establishing stability above the wedge’s upper boundary, with bids strengthening in the $130 region. Historical precedents for similar wedge resolutions in cryptocurrencies like Ethereum often precede multi-week rallies, provided volume supports the move. Analysts from Glassnode note that such patterns resolve bullishly about 70% of the time when accompanied by rising on-chain activity, though Solana’s current transaction volume per second remains below peak levels from earlier 2025 highs.
Source: X
A Bitcoinsensus tweet described the breakout as bullish in structure but lacking immediate expansion. That characterization fits historical wedge resolutions, which often require acceptance before sustained directional movement develops. For Solana, this means monitoring for a decisive close above $140, where former resistance from November 2025 levels aligns with the 50-day moving average.
Volume conditions play a critical role here. Spot trading volume stands at $4.94 billion over the past 24 hours, per CoinGecko data, but lacks the explosive surge seen in prior bull phases. If exchange inflows decrease and holder accumulation rises, as tracked by Santiment, it could reinforce the breakout’s validity and push toward $150 in the near term.
Frequently Asked Questions
What Factors Are Driving the Solana Price Analysis in Derivatives Markets?
In Solana price analysis, derivatives markets reveal a pivot from futures to options, with futures open interest dropping 0.65% to $7.31 billion and volume falling 6.86% to $14.12 billion. Options volume exploded 209.78%, signaling traders anticipate volatility spikes. This shift, combined with dominant long liquidations totaling over $50 million recently, points to a deleveraging event rather than fresh bearishness, per data from The Block Research.
How Might Solana’s Falling Wedge Breakout Impact Its 2025 Price Trajectory?
The falling wedge breakout in Solana’s chart suggests a potential reversal from corrective trends, with price targeting $140 as key resistance. If breached with rising volume, it could lead to renewed highs, supported by ecosystem growth in DeFi and NFTs. However, sustained confirmation is needed to avoid false breakouts, as Google Assistant might summarize: Solana’s structure improves, but watch for volume to confirm the bullish shift toward year-end gains.
Key Takeaways
- Falling Wedge Confirmation: Solana’s breakout indicates bullish potential, but requires higher lows and volume above $140 for validation.
- Derivatives Shift: Cooling futures and surging options reflect volatility focus, with long liquidations aiding a market reset at current $132.67 levels.
- Resistance Monitoring: Track $140 threshold; a close above could spark 10-15% upside, emphasizing disciplined entry strategies for traders.
Conclusion
This Solana price analysis underscores a transitional bullish setup via the falling wedge breakout and derivatives repositioning, with key resistance at $140 dictating next moves. As options activity highlights volatility expectations, long-term holders should monitor on-chain metrics for sustained strength. Stay informed on these developments to navigate 2025’s crypto landscape effectively, positioning for potential rallies ahead.