Solana Holds $130 Pivot, Potential Bullish Path to $250 Amid Long-Term Patterns
SOL/USDT
$1,629,887,570.10
$84.29 / $82.26
Change: $2.03 (2.47%)
-0.0164%
Shorts pay

Contents
Solana holds the $130 pivot, sustaining a bullish structure toward $250 amid key support levels. Analysts highlight risks below this threshold, with long-term Cup and Handle patterns projecting up to $2,000, while short-term consolidation builds momentum above rising trendlines since early 2023.
-
Solana maintains the $130 pivot, trading in an upward structure targeting $250.
-
SOL consolidates between $130 support and $293 resistance, with buyers forming higher lows.
-
A multi-year Cup and Handle pattern suggests a long-term projection near $2,000, per analyst observations.
Solana $130 pivot analysis: Discover bullish targets, risks, and long-term patterns for SOL price. Stay informed on crypto trends and make strategic decisions today.
What is the significance of Solana holding the $130 pivot?
Solana holding the $130 pivot confirms short-term bullish momentum, as the asset has bounced cleanly from this level, restoring strength in the broader market. This support aligns with the rising trendline from early 2023, guiding price action and keeping upside potential toward $250 intact. Traders view sustained trades above $130 as a key signal for continued upward structure.
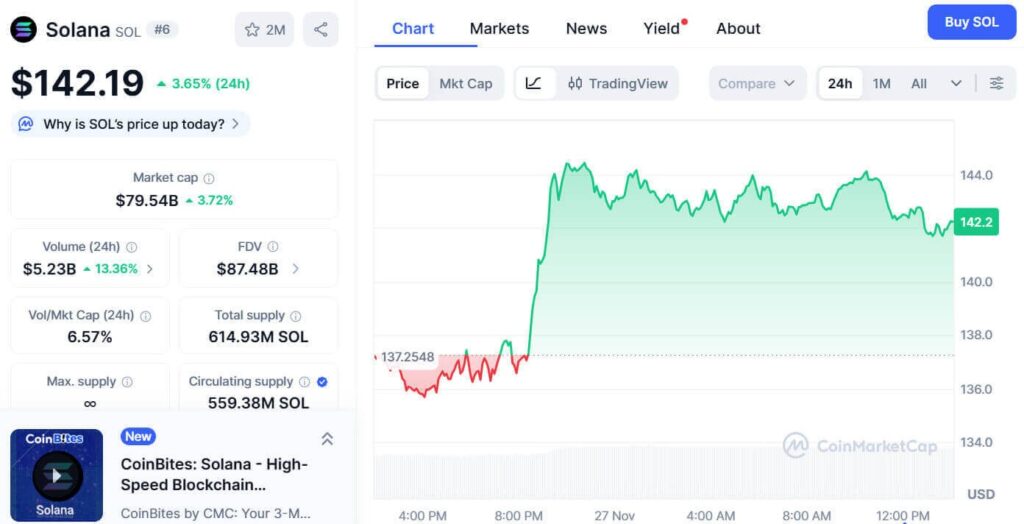
Source: CoinMarketCap
Solana trades above the $130 support after a clean bounce that restored short-term strength across the market. The weekly structure shows steady reactions along the rising trendline that has guided price since early 2023, and traders now focus on the $130 pivot because this level defines the next directional phase. CoinMarketCap data indicates SOL trading near $142.19 with a 24-hour gain of 3.65% while volume rose more than 13%. Price moved from the $137 region into the $143 area, and the chart recorded steady buying interest around $140. The market formed higher lows across the 24-hour period, and buyers kept control as SOL moved within an upward channel.
$SOL reclaimed the $130 support with a clean bounce.
Sustained acceptance above $130 reactivates the $250 upside target.
Failure to hold converts structure bearish, opening downside toward the 0.382 Fib retrace at $75 and the 0.5 Fib level at $50.
$130 remains the critical… pic.twitter.com/fSfarBhKp6
— Crypto Patel (@CryptoPatel) November 26, 2025
According to an observation by Crypto Patel, continued strength above $130 maintains the broader range and keeps the $250 target open. The structure has rejected the $293 zone many times, and SOL continues to consolidate between this resistance and the $130 base. Solana is trading above long-term support while remaining under the wider resistance zone near $293.13. The market continues to move between the ascending trend support and the broad horizontal zone created across 2024 and 2025. The latest retest of the rising trendline produced a stable reaction, and the asset held within a wide support area.
How do key risk zones impact Solana’s long-term patterns?
If buyers fail to hold the $130 level, the structure turns bearish and exposes the lower retracement areas. Chart data shows the 0.382 Fibonacci retracement near $75 and the 0.5 level near $50. Both zones align with past accumulation periods from early 2023, and the weekly chart also shows a Fair Value Gap between these levels. According to analysis by Crypto Curb, Solana forms a multi-year Cup and Handle pattern with a projected target near $2,000. The pattern shows a broad rounded base from 2021 to 2023 while the handle forms under horizontal resistance. The breakout moves into a rising structure, and the projection aligns with the long-term target area. The $130 pivot remains the central level for trend confirmation as SOL continues to trade in a stable structure. This pattern development underscores the importance of monitoring risk zones, as a break below $130 could invalidate short-term gains but the overall bullish framework persists on higher timeframes.
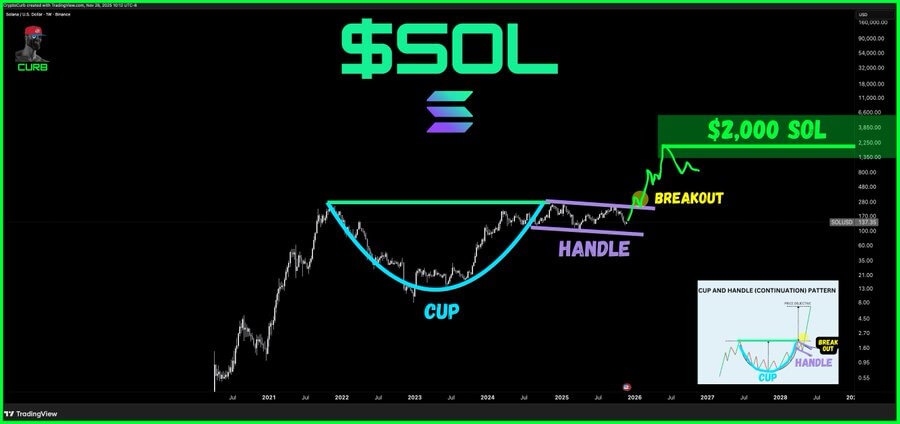
Source: CryptoCurb(X)
Solana’s price action reflects broader market dynamics, with institutional interest and network upgrades contributing to sustained support at key levels. Data from trading platforms confirms increased volume during recent bounces, signaling accumulation by long-term holders. Analysts emphasize that the $130 pivot not only serves as immediate support but also anchors the multi-year bullish thesis, provided downside risks are managed effectively.
Frequently Asked Questions
What happens if Solana breaks below the $130 pivot?
If Solana breaks below the $130 pivot, the structure shifts bearish, targeting the 0.382 Fibonacci retracement at $75 and the 0.5 level at $50. These zones align with historical accumulation areas from 2023, potentially attracting buyers if volume supports a reversal, but immediate downside pressure would dominate short-term trading.
Is the Solana Cup and Handle pattern reliable for long-term forecasts?
The multi-year Cup and Handle pattern on Solana’s chart, forming since 2021, projects a target near $2,000 upon breakout, based on classic technical analysis principles. This setup, with a rounded base and consolidation handle, has held through market cycles, offering a reliable framework for long-term investors when combined with on-chain metrics like transaction volume.
Key Takeaways
- Solana’s $130 pivot strength: Holding this level sustains bullish momentum toward $250, with higher lows indicating buyer control.
- Long-term pattern potential: The Cup and Handle formation suggests upside to $2,000, aligned with rising trendlines from 2023.
- Risk management essential: Monitor breaks below $130 for bearish shifts toward $75-$50; use volume data for confirmation.
Conclusion
Solana’s hold at the $130 pivot reinforces its bullish structure, targeting $250 short-term while the long-term Cup and Handle pattern eyes $2,000. Key risk zones at lower Fibonacci levels demand vigilance, but sustained support and rising volume point to continued strength. Investors should track these developments closely for informed positioning in the evolving crypto landscape.
Comments
Other Articles
Solana Leads 2025 Revenue as Bulls Test $130 Resistance
January 1, 2026 at 10:32 AM UTC
Bitwise Files for 11 Altcoin ETFs Including AAVE, UNI Amid SOL, XRP Muted Gains
December 31, 2025 at 08:47 PM UTC
Ethereum Whales Trim ETH Longs and Pivot to BTC in Dec 31 On-Chain Rebalance Update
December 31, 2025 at 01:27 PM UTC