Solana Nears Key Supports as Traders Eye $142.60 Resistance Amid ETF Inflows
SOL/USDT
$3,585,941,421.89
$93.68 / $89.82
Change: $3.86 (4.30%)
-0.0001%
Shorts pay

Contents
Solana (SOL) is currently trading near key support levels at $135.50 and $132.84 amid a corrective wave structure. Analysts are monitoring resistance zones at $142.60 and $144.60, with rising open interest and ETF inflows signaling potential bullish momentum if these barriers break.
-
SOL holds support at $135.50 following a three-wave pullback from $144.60 resistance.
-
Next supports include $132.84, $130.17, and $126.47 in an active correction.
-
Open interest rose 1.7% to add leverage, while ETF net inflows reached $5.3 million, per Farside Investors data.
Solana price analysis reveals key supports at $135.50 as SOL eyes $142.60 resistance. Discover ETF inflows and accumulation trends driving potential recovery. Stay informed on SOL’s next move today.
What Are the Key Support and Resistance Levels for Solana?
Solana (SOL) is navigating a corrective price structure with immediate support at the 38.2% Fibonacci retracement of $135.50, following a rejection at $144.60 last week. This level has held firm, with additional supports at $132.84, $130.17, and $126.47 forming a potential downside buffer if selling pressure intensifies. Traders are closely watching for a bounce toward resistance zones at $142.60 and $144.60 to signal renewed upward momentum.
Solana entered the weekend stabilizing around the mid-$130s, as market participants assessed the aftermath of the recent high near $144.60. The asset completed a clear three-wave pullback, now testing the initial support zone. This structure suggests a measured correction rather than a sharp reversal, with volume indicators showing balanced activity between buyers and sellers.
Observations from More Crypto Online highlight that breaking above $142.60 could indicate Solana’s readiness to retest higher resistances, potentially targeting $157 if momentum builds. The $144.60 level remains a critical barrier, having capped the prior rally and now serving as a pivotal point for directional confirmation.
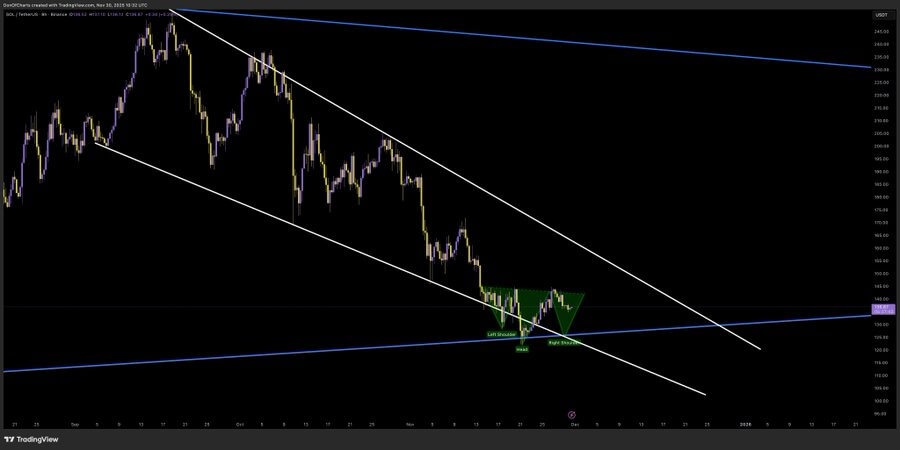
Earlier in the session, buyers stepped in at the 61.8% retracement of $138.28, countering seller pressure around $138.71 and $142.63. Donalds Trades noted the emergence of an inverse head-and-shoulders pattern within a descending wedge, which could project toward $160 if validated. Price action is consolidating mid-wedge, with attention on the upper trendline for breakout cues.
How Is Market Participation Influencing Solana’s Price Action?
Solana’s price stability is bolstered by increasing open interest and positive funding rates, reflecting sustained trader engagement. Coinglass data indicates a 1.7% rise in open interest, adding approximately $12.5 million in notional value to defend the $135 region, while funding rates at 0.0027% underscore bullish sentiment among leveraged positions. This participation helps mitigate downside risks during the correction.
ETF activity further supports the ecosystem, with Farside Investors reporting $5.3 million in net inflows on Friday, rebounding from a prior outflow linked to the 21Shares Solana staking ETF application withdrawal. These inflows demonstrate institutional confidence, contributing to a resilient floor around current levels. Corporate treasuries have also ramped up holdings, surpassing 16 million SOL in 2025, which reinforces long-term support and counters short-term volatility.
Short candles and controlled volume within the $135.57 to $130.17 Fibonacci zone signal an ongoing B-wave in the correction, following a completed A-wave. Analysts anticipate a potential short-term rebound if volume confirms at these supports, setting the stage for a challenge against the $142.60 resistance. Expert commentary from Donalds Trades emphasizes the inverse head-and-shoulders as a bullish signal, provided the pattern resolves higher within the broader wedge.
Frequently Asked Questions
What Are the Next Support Levels for Solana If It Breaks Below $135.50?
If Solana dips below $135.50, the subsequent supports at $132.84, $130.17, and $126.47 come into play, based on Fibonacci retracements and prior lows. These levels align with the corrective structure’s projected targets, where increased buying from treasuries could stabilize the price and prevent deeper declines.
Is Solana’s Open Interest Increase a Bullish Sign for Traders?
Yes, the 1.7% rise in open interest, coupled with positive funding rates, indicates growing bullish positions protecting key supports. This trend, observed across major exchanges, suggests traders are positioning for an upside move, especially with ETF inflows adding to the positive momentum.
Key Takeaways
- Support Zone Strength: Solana’s hold at $135.50 highlights robust defense, with lower levels at $132.84 and $130.17 ready as backups in the correction.
- Resistance Challenges: Breaking $142.60 is essential for targeting $144.60 and higher, per analyst patterns like the inverse head-and-shoulders.
- Institutional Backing: ETF inflows of $5.3 million and treasury accumulation over 16 million SOL provide a solid foundation for potential recovery.
Conclusion
Solana’s price analysis points to a pivotal moment near key support levels at $135.50, with resistance at $142.60 and $144.60 dictating the next phase. Backed by rising open interest, ETF inflows, and corporate accumulation, SOL demonstrates resilience in its corrective structure. As market participation strengthens, investors should monitor these zones for breakout signals, positioning for sustained growth in the evolving crypto landscape.
Add COINOTAG as a Preferred Source
Add COINOTAG to your preferred sources in Google News and Search to see our coverage first.
Add on GoogleRelated Tags
Comments
Other Articles
Coinbase (COIN) bounces 10%, Solana, LINK, SUI outperform as bitcoin (BTC) holds $80K
May 8, 2026 at 08:59 PM UTC
Zcash to add quantum-recoverable wallets within a month, go post-quantum by 2027
May 8, 2026 at 09:08 AM UTC
Bitcoin ETFs Extend Rally as Two-Day Inflows Near $1 Billion
May 6, 2026 at 10:40 AM UTC