Solana Risks Further Decline as Whale Expands Leveraged Short to $15.9M Profit
SOL/USDT
$2,181,631,015.68
$94.80 / $92.39
Change: $2.41 (2.61%)
-0.0008%
Shorts pay

Contents
A prominent cryptocurrency whale has amplified a 20x leveraged short position on Solana (SOL), securing approximately $15.9 million in unrealized gains. This move underscores deep bearish conviction as Solana’s price faces sustained downward pressure from technical trends and market selling.
-
Solana’s descending regression trend confirms seller dominance, with price action forming lower highs and RSI at 37 indicating weak momentum.
-
Spot taker cumulative volume delta remains negative over 90 days, reflecting persistent distribution by sellers rather than panic exhaustion.
-
Derivatives markets show shorts dominating at over 60% of positions, with long/short ratio near 0.63, aligning with downside liquidity clusters targeting $120 support.
Solana price analysis reveals a whale’s massive 20x SOL short yielding $15.9M profits amid bearish trends. Explore technical indicators and support levels—stay ahead in crypto markets today.
What is the impact of the whale’s leveraged short on Solana price?
Solana price prediction points to increased downside risks following a major whale’s expansion of a 20x leveraged short position, now holding about $15.9 million in floating profits. This strategic scaling during periods of market weakness, rather than after extreme sell-offs, signals strong expectations of continued declines for SOL. Market participants often mirror such whale activities, amplifying bearish sentiment and pressuring prices lower without immediate reversal threats.
How do technical indicators support a bearish Solana outlook?
Solana’s price continues to adhere to a descending regression channel, where each attempted rebound encounters firm resistance from sellers, preventing any sustained upside. The relative strength index (RSI) lingers at 37, well below the neutral 50 level, and lacks bullish divergence, which would otherwise hint at potential reversals. According to data from TradingView, this setup maintains structural weakness, positioning SOL for a possible test of the $120 support zone. Should selling intensify, the $100 level emerges as a deeper target, where historical data suggests buyer interest could intensify. Experts note that without a break above trend resistance, momentum favors further corrections, aligning with broader cryptocurrency market dynamics observed in late 2025.
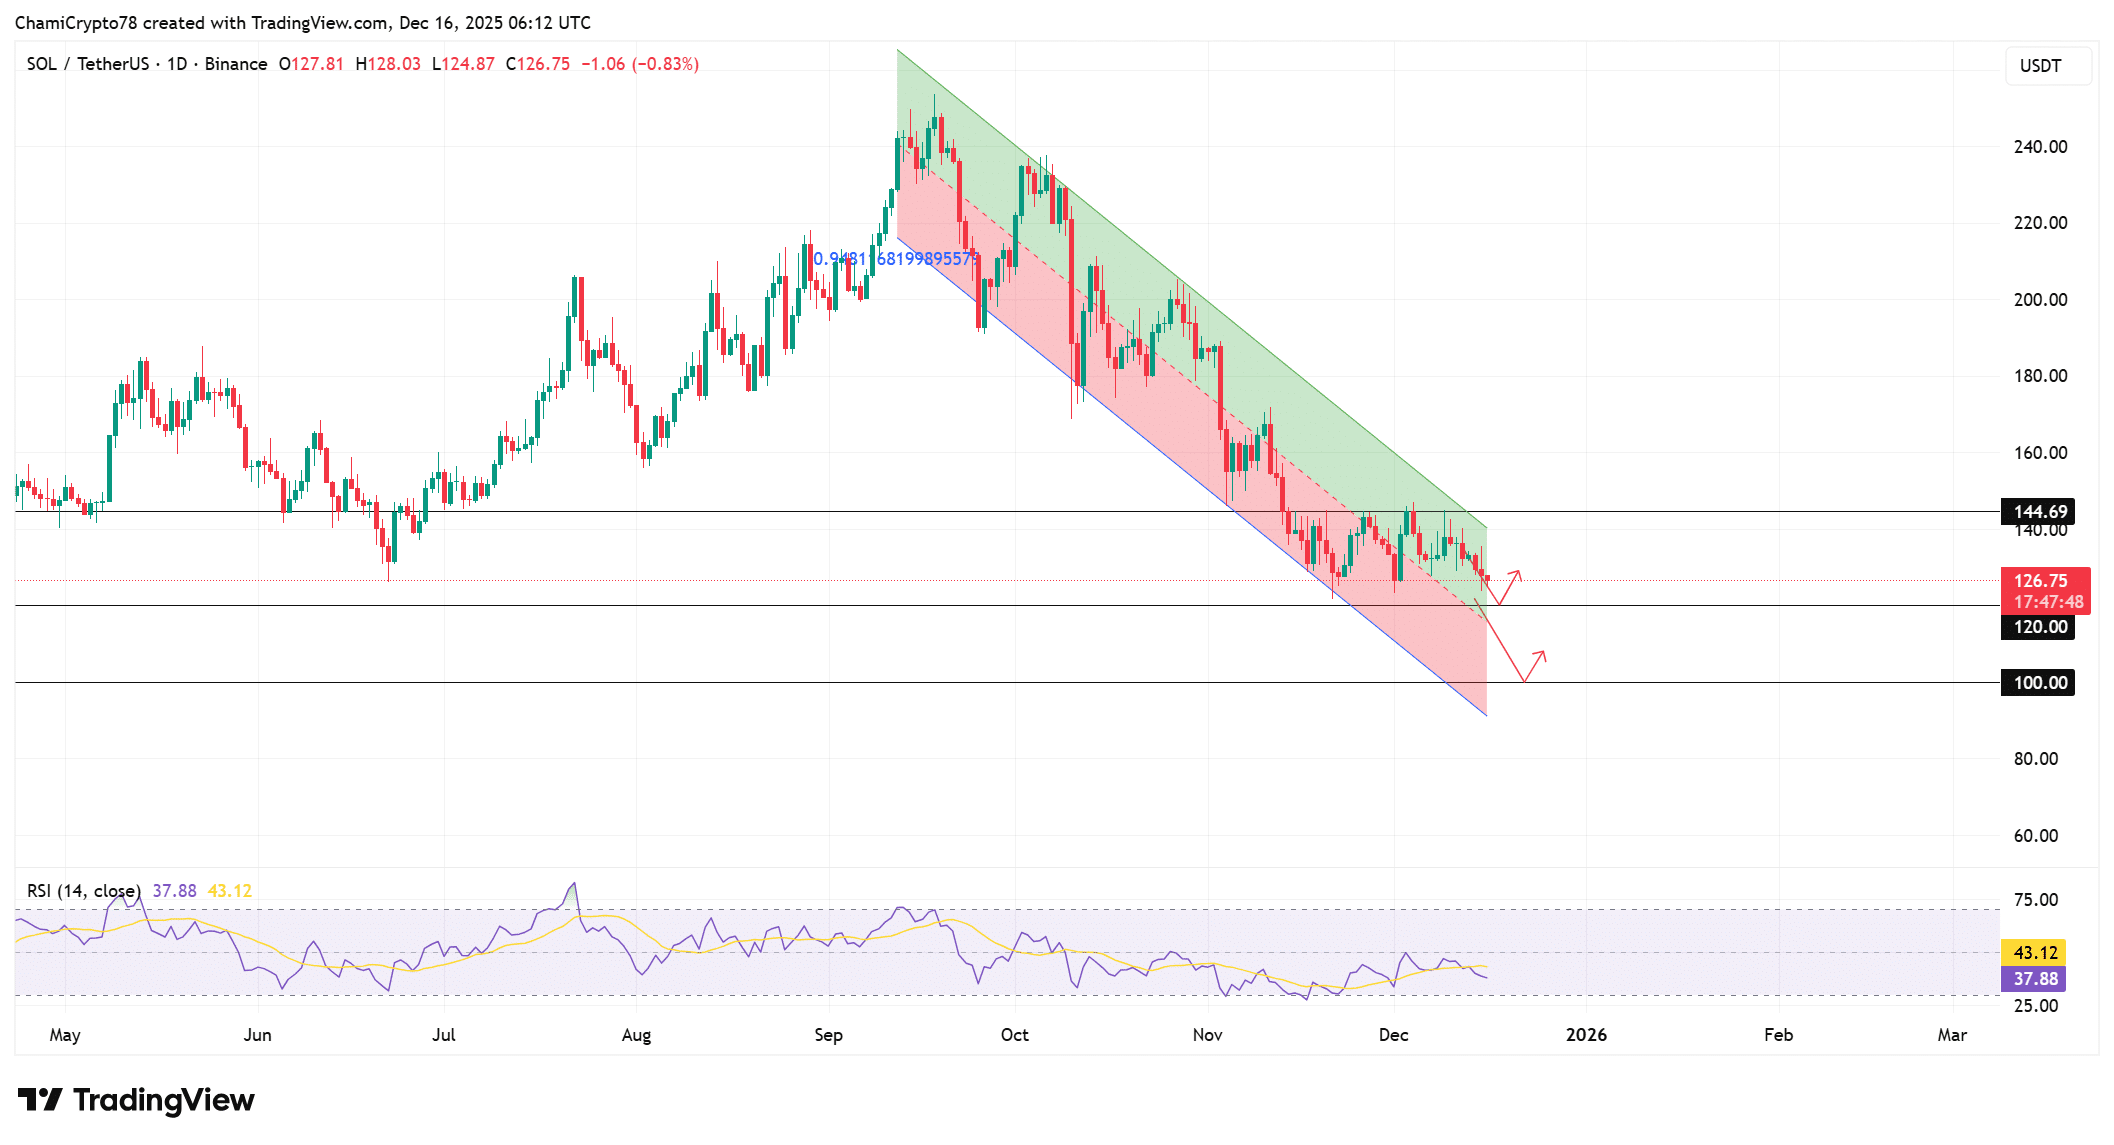
Source: TradingView
How is spot market activity influencing Solana’s price trajectory?
In the spot markets, Solana exhibits clear signs of seller dominance, with the taker cumulative volume delta (CVD) maintaining a negative trajectory over the past 90 days. This metric, derived from CryptoQuant analysis, highlights direct bid-hitting by sellers, driving prices downward in a controlled distribution phase rather than erratic panic selling. Brief pauses in this activity may spark minor bounces, but they consistently fail to reverse the CVD to positive territory, capping any corrective rallies. As a result, Solana’s price remains vulnerable to further erosion, potentially reaching the $120 level where initial buyer absorption could occur. Data indicates that sustained negative CVD correlates with prolonged bearish phases in altcoins like SOL, emphasizing the need for vigilance among investors monitoring on-chain flows.
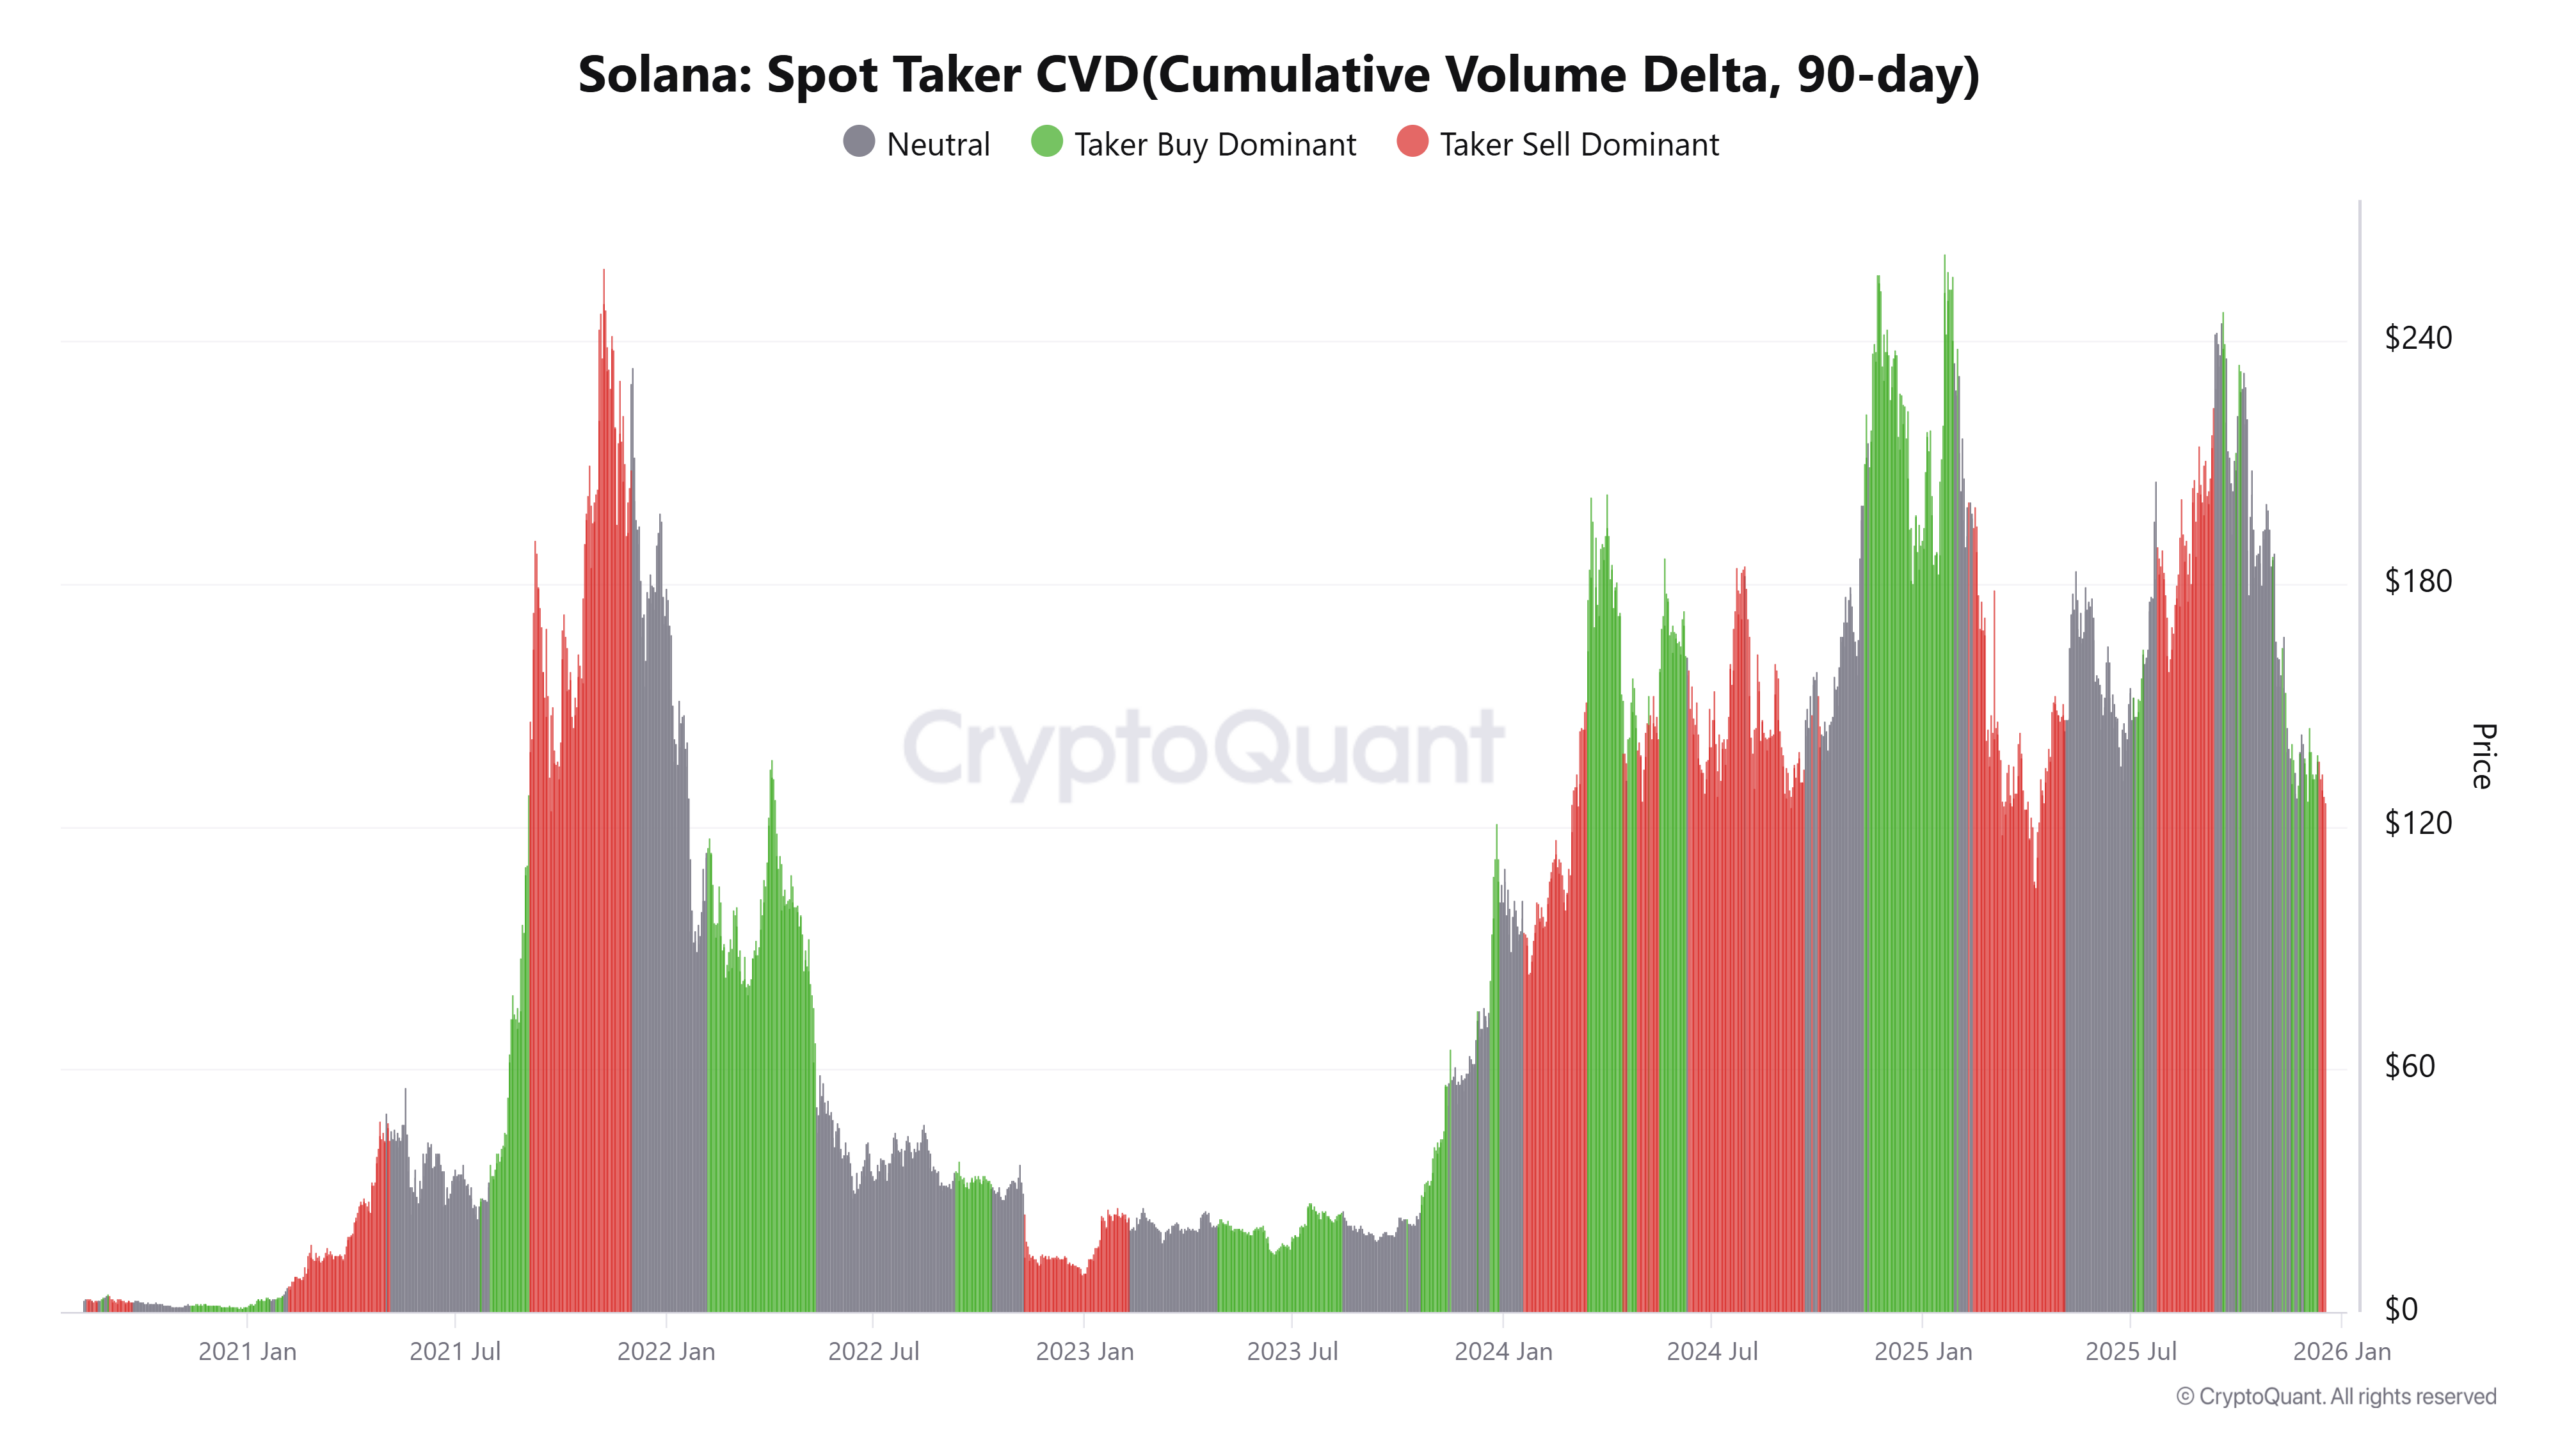
Source: CryptoQuant
What role do derivatives play in the bearish Solana sentiment?
Derivatives markets for Solana reveal a crowded short positioning, with the long/short ratio standing at approximately 0.63, meaning shorts comprise over 60% of open interest. This imbalance, as tracked by CoinGlass, reflects traders’ alignment for price continuation lower rather than betting on a rebound. While extreme short crowding can occasionally lead to volatility through squeezes, current price structure—confined below key resistance—mitigates upside risks, and favorable funding rates support short holders. Consequently, this derivatives flow bolsters the overall bearish momentum, increasing the likelihood of Solana testing $120 and potentially $100 if support fails. Market analysts from platforms like CoinGlass emphasize that such one-sided positioning often precedes deeper corrections in volatile assets like SOL.
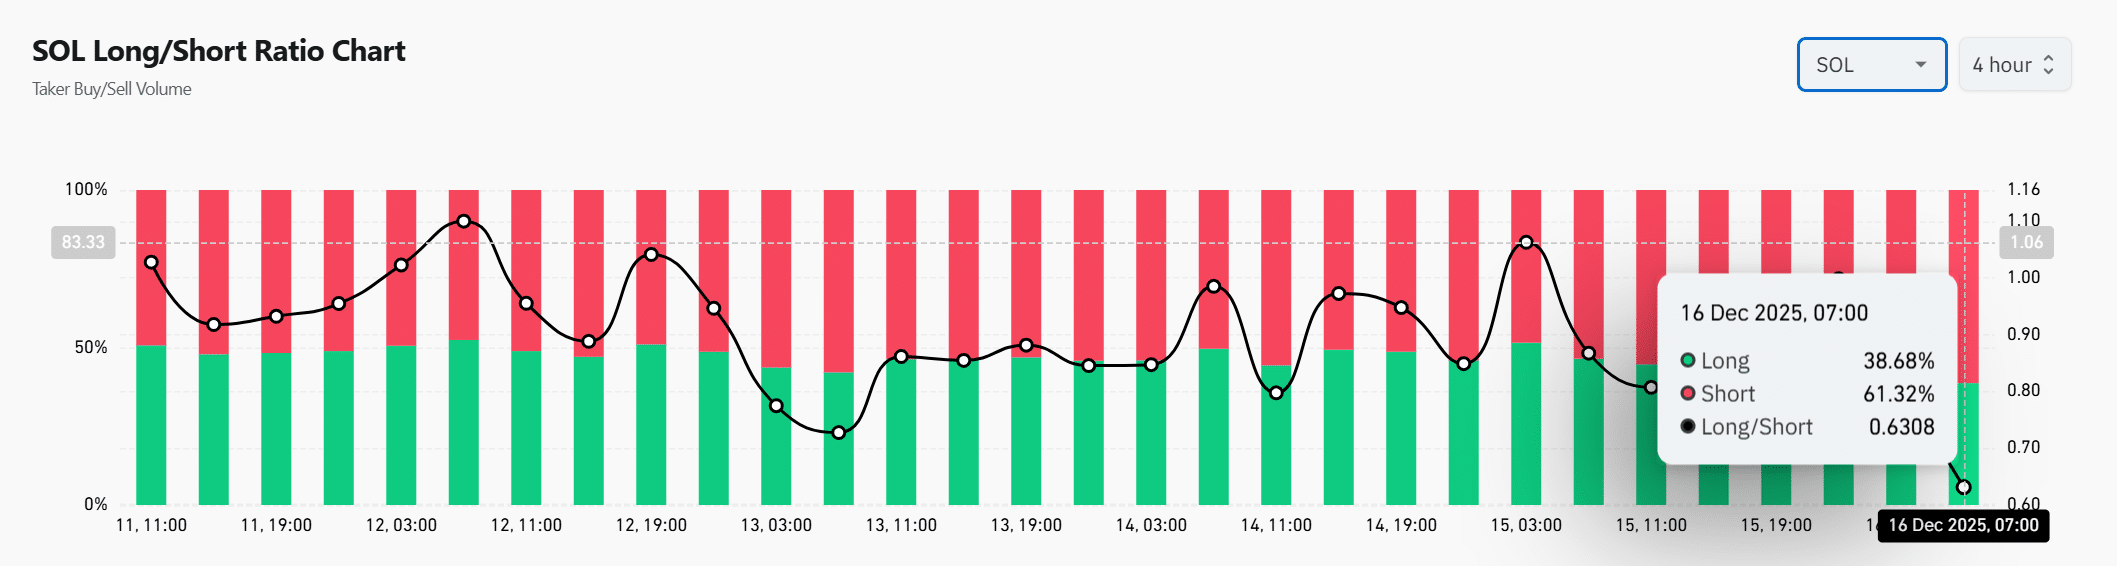
Source: CoinGlass
How does liquidity distribution affect Solana’s potential price movements?
Liquidation heatmaps illustrate concentrated downside liquidity for Solana below current levels, creating natural pull points that attract price during bearish trends. These clusters, visible in 24-hour data from CoinGlass on Binance’s SOL/USDT pairs, often trigger heightened volatility as sellers push toward them to force long liquidations. In contrast, upside liquidity appears sparse, discouraging aggressive buying and limiting rally potential. As Solana navigates this landscape, consolidation patterns above these pools typically resolve downward in trending conditions, drawing price first to $120 liquidity zones. Intensified selling could extend this to $100, where accumulated interest from long-term holders might counterbalance the pressure. Such liquidity dynamics, as analyzed by on-chain experts, play a crucial role in forecasting short-term price paths in high-leverage environments.
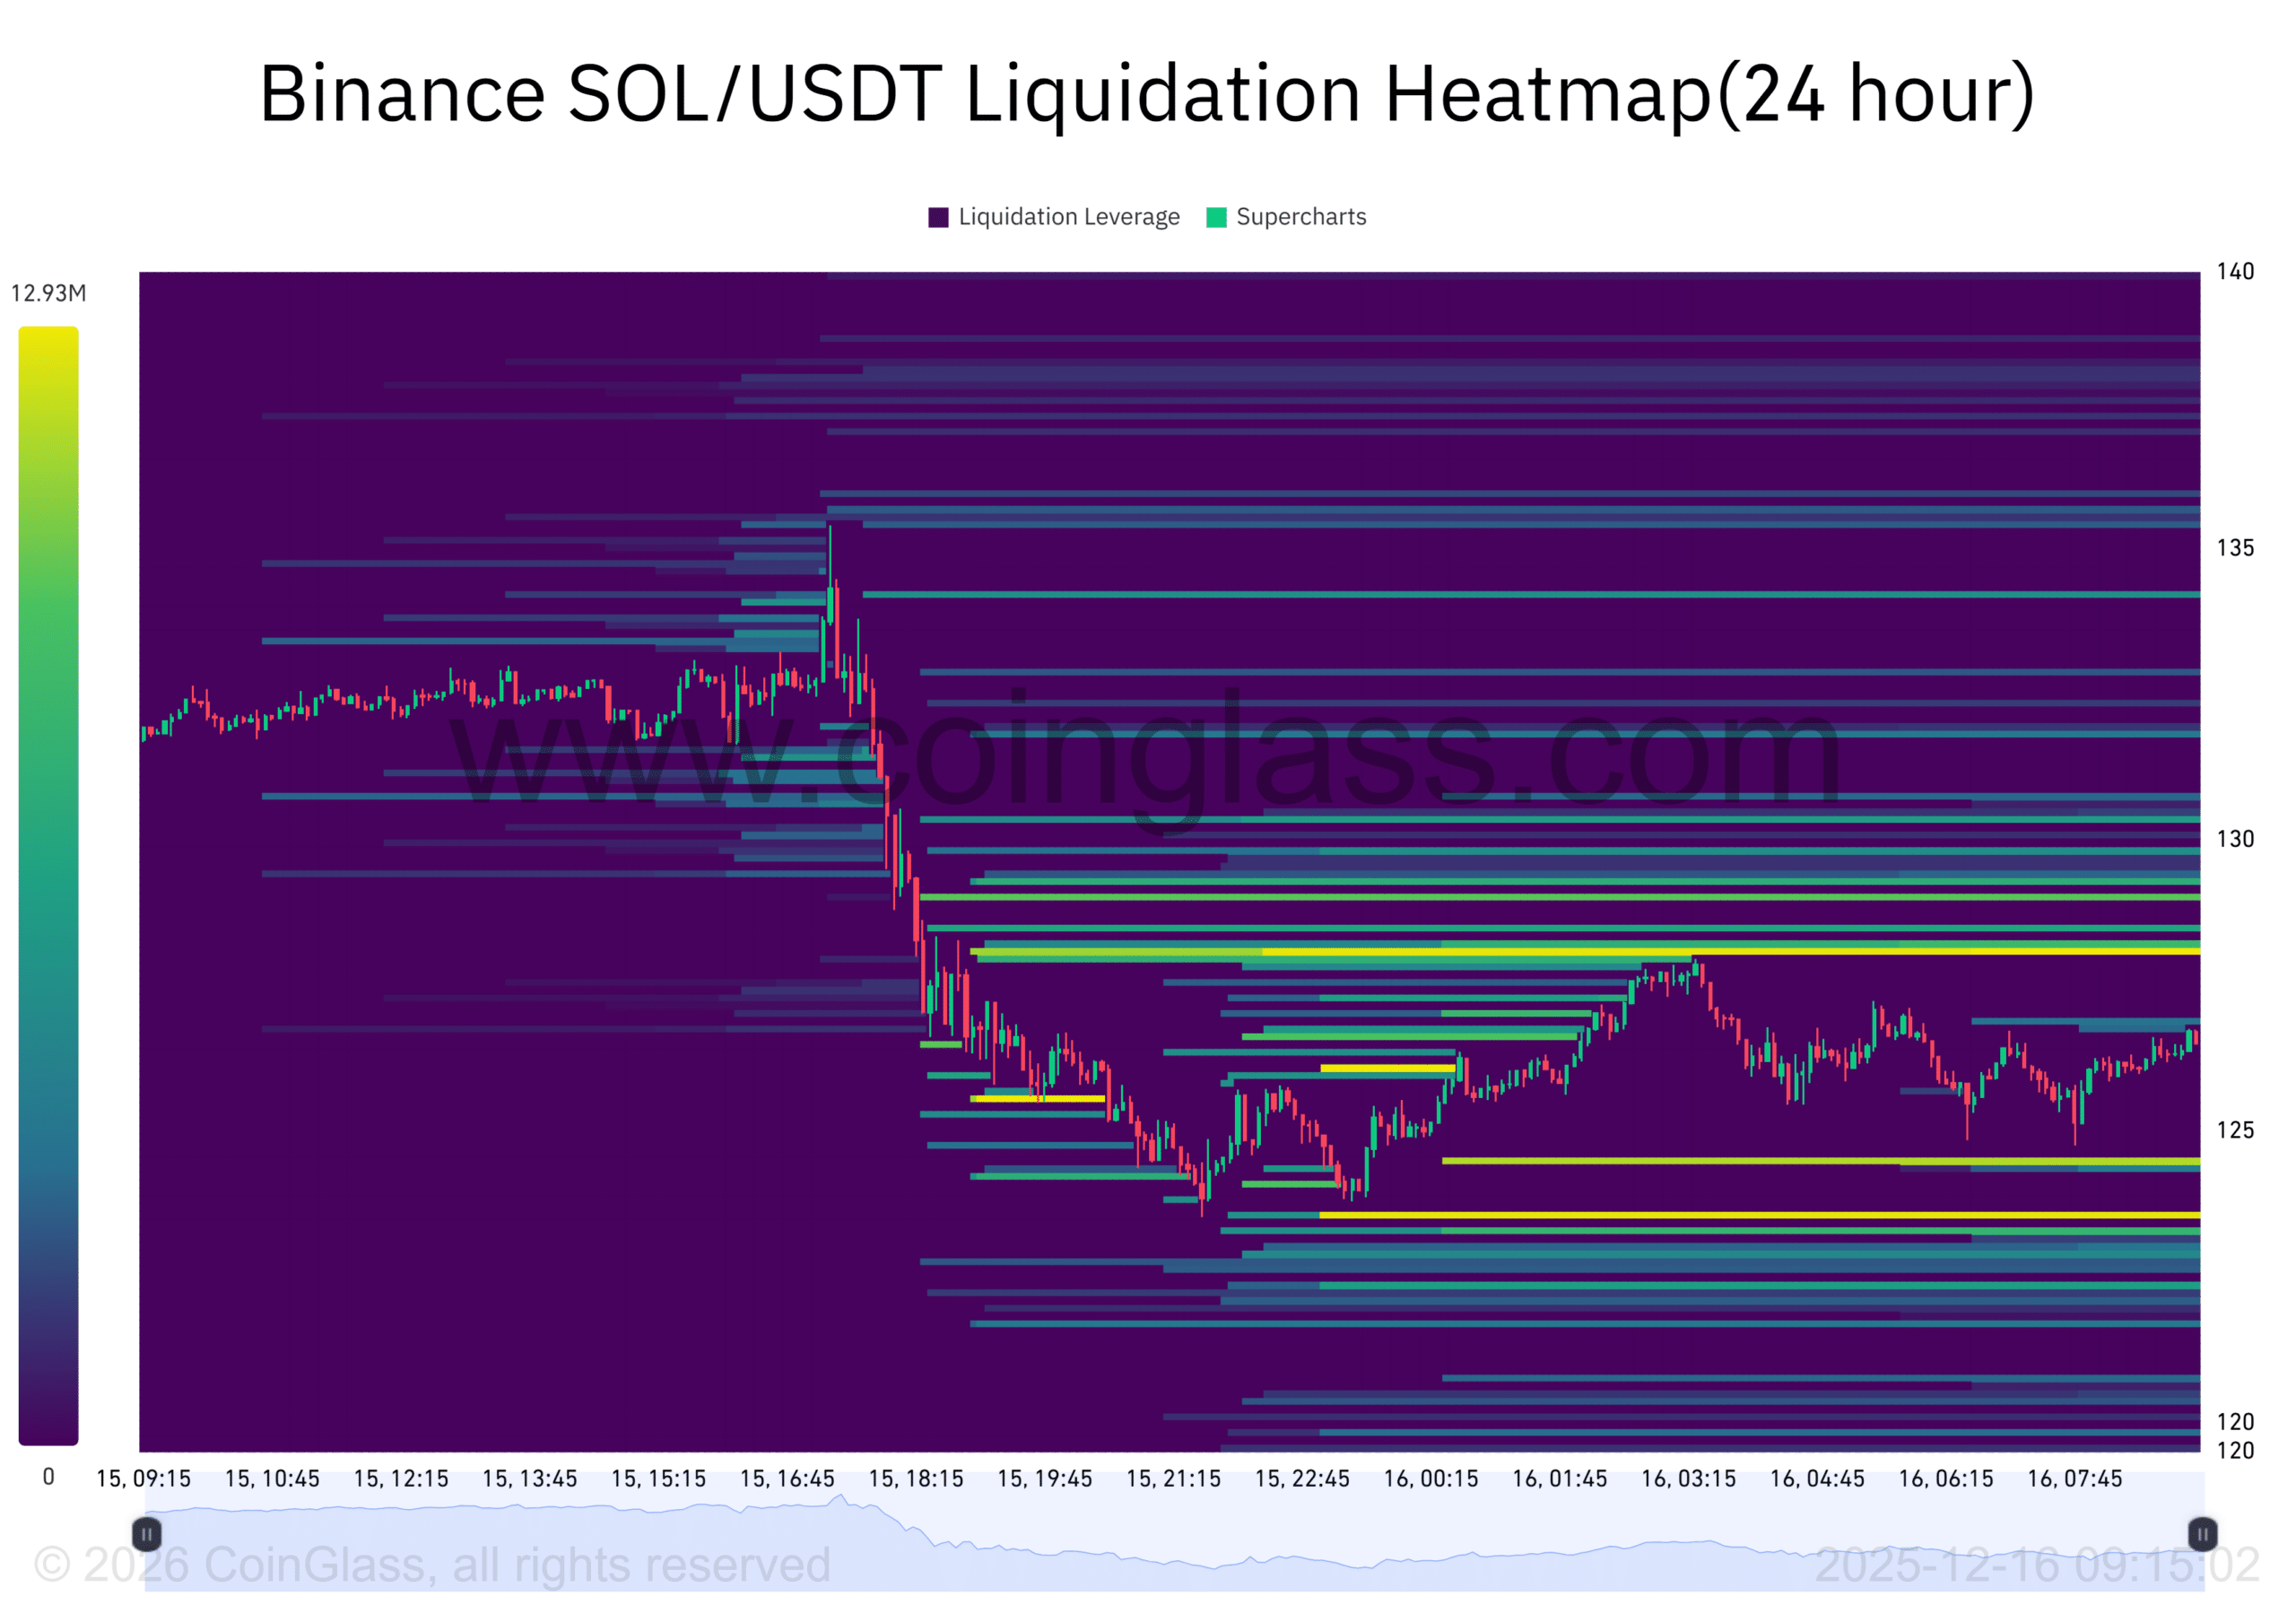
Source: CoinGlass
Overall, the confluence of whale leverage, technical resistance, spot selling, derivatives imbalance, and liquidity pulls establishes a firmly bearish framework for Solana. This positioning suggests limited near-term upside, with $120 as the immediate focal point for potential stabilization.
If bearish forces hold, SOL’s descent toward $100 could materialize, prompting a reassessment of accumulation opportunities among institutional players.
Frequently Asked Questions
What profit has the whale realized from the Solana short position?
The whale’s 20x leveraged short on Solana has generated around $15.9 million in unrealized profits, based on position expansions during recent market dips. This gain stems from SOL’s price declining amid weak demand, with no signs of reversal in key indicators like RSI and CVD.
Could Solana’s price fall to $100 in the current market?
Yes, Solana’s price could reach $100 if the descending trend persists and $120 support breaks, as indicated by negative spot CVD and crowded shorts in derivatives. However, this level might attract buyers for accumulation, potentially halting further drops—voice search users should monitor on-chain data for real-time updates.
Key Takeaways
- Whale conviction drives shorts: The expansion of a high-leverage SOL short to $15.9M profits reinforces bearish expectations without hedging intent.
- Technicals align downward: Descending regression, low RSI, and negative CVD confirm seller control, targeting $120 initially.
- Liquidity favors downside: Heatmap clusters below current prices pull SOL lower, with $100 as a potential accumulation zone if pressure builds.
Conclusion
In this Solana price prediction, multiple factors—including the whale’s amplified short position, bearish technical trends, and dominant selling in spot and derivatives markets—point to ongoing weakness for SOL. As liquidity dynamics continue to favor downside moves, investors should watch the $120 support closely for signs of reversal. Preparing for potential extensions to $100 while tracking authoritative sources like TradingView and CryptoQuant will aid in navigating the volatile cryptocurrency landscape ahead.
Add COINOTAG as a Preferred Source
Add COINOTAG to your preferred sources in Google News and Search to see our coverage first.
Add on GoogleRelated Tags
Comments
Other Articles
Coinbase (COIN) bounces 10%, Solana, LINK, SUI outperform as bitcoin (BTC) holds $80K
May 8, 2026 at 08:59 PM UTC
Zcash to add quantum-recoverable wallets within a month, go post-quantum by 2027
May 8, 2026 at 09:08 AM UTC
Bitcoin ETFs Extend Rally as Two-Day Inflows Near $1 Billion
May 6, 2026 at 10:40 AM UTC