Solana Signals Potential Rebound as Whales Accumulate and Supply Tightens
SOL/USDT
$1,629,887,570.10
$84.29 / $82.26
Change: $2.03 (2.47%)
-0.0164%
Shorts pay

Contents
Solana shows strong rebound signals as 439,938 SOL moves from Coinbase to an unknown wallet, indicating whale accumulation amid tightening supply. Negative netflows of $39.65M reduce selling pressure, while technical patterns like falling wedges and double bottoms suggest buyers are defending key support levels around $123–$130, positioning for a potential breakout.
-
Solana’s whale transfers: 439,938 SOL outflow from Coinbase signals accumulation over distribution, boosting reversal confidence.
-
Negative netflows tighten supply, with $39.65M recent outflow highlighting reduced exchange selling pressure for a rebound setup.
-
Technical indicators show falling wedge and double bottom patterns, with MACD curling upward and 80.21% long bias supporting bullish momentum near $123–$130 support.
Solana rebound signals emerge with whale accumulation and tightening supply; explore netflows, technical patterns, and bullish sentiment driving potential price recovery in this analysis.
Is Solana Preparing for a Rebound?
Solana is exhibiting clear preparatory signs for a rebound, driven by significant whale activity and favorable on-chain metrics. A transfer of 439,938 SOL from Coinbase Institutional to an unknown wallet underscores accumulation trends, reducing available supply and diminishing short-term selling pressure. Technical formations like a falling wedge and double bottom further bolster expectations of an upward reversal if support holds.
How Do Solana Netflows Confirm Tightening Supply Pressure?
Solana has seen consistent negative netflows, including a notable $39.65 million outflow from exchanges, which points to investors withdrawing tokens for long-term holding rather than immediate sales. This dynamic, observed across major platforms, eases selling pressure and creates a supportive environment for price stabilization near current levels. Data from CoinGlass indicates these outflows align with broader market compression, where reduced liquidity on exchanges could catalyze a rebound once volatility eases. Experts note that such patterns historically precede bullish shifts in high-throughput blockchains like Solana, with supply tightening often leading to 20-30% gains in similar setups. Short paragraphs aid readability: buyers are stepping in aggressively, defending the $123–$130 zone, while the 90-day taker buy cumulative volume delta (CVD) climbs steadily, reflecting sustained demand absorption.
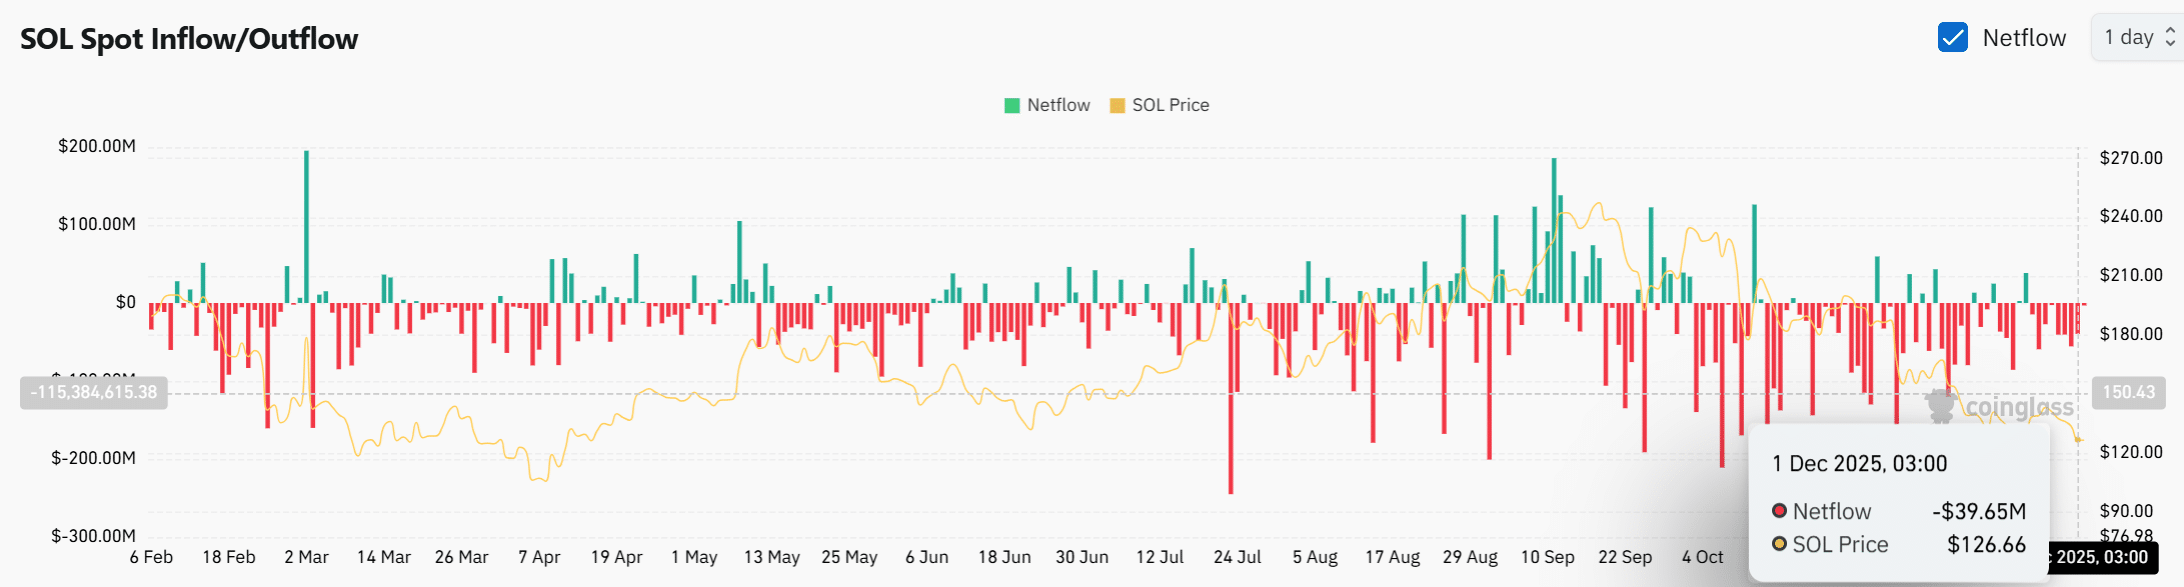
Source: CoinGlass
In this context, the combination of outflows and whale movements reinforces a narrative of strategic positioning. Market participants are closely monitoring whether these factors will compress sell-side liquidity sufficiently to enable a decisive move higher. Failure to maintain support could invite temporary pullbacks, but current data leans toward accumulation dominance.
Frequently Asked Questions
What Impact Does Whale Accumulation Have on Solana’s Price Outlook?
Whale accumulation, such as the recent 439,938 SOL transfer from Coinbase, signals strong investor confidence in Solana’s long-term value, reducing circulating supply and potential downside pressure. This activity often precedes price recoveries by absorbing available tokens, with historical data showing similar moves leading to 15-25% upswings within weeks when paired with technical support.
Why Is Solana’s Long/Short Ratio Indicating Bullish Sentiment?
Solana’s long/short ratio stands at 80.21% longs versus 19.79% shorts, reflecting trader optimism for an upward move from current compressed levels. This imbalance suggests early positioning for a rebound, especially as buy-side aggression grows; when spoken aloud, it highlights how improving sentiment could drive Solana toward resistance at $143 if volume supports the shift.
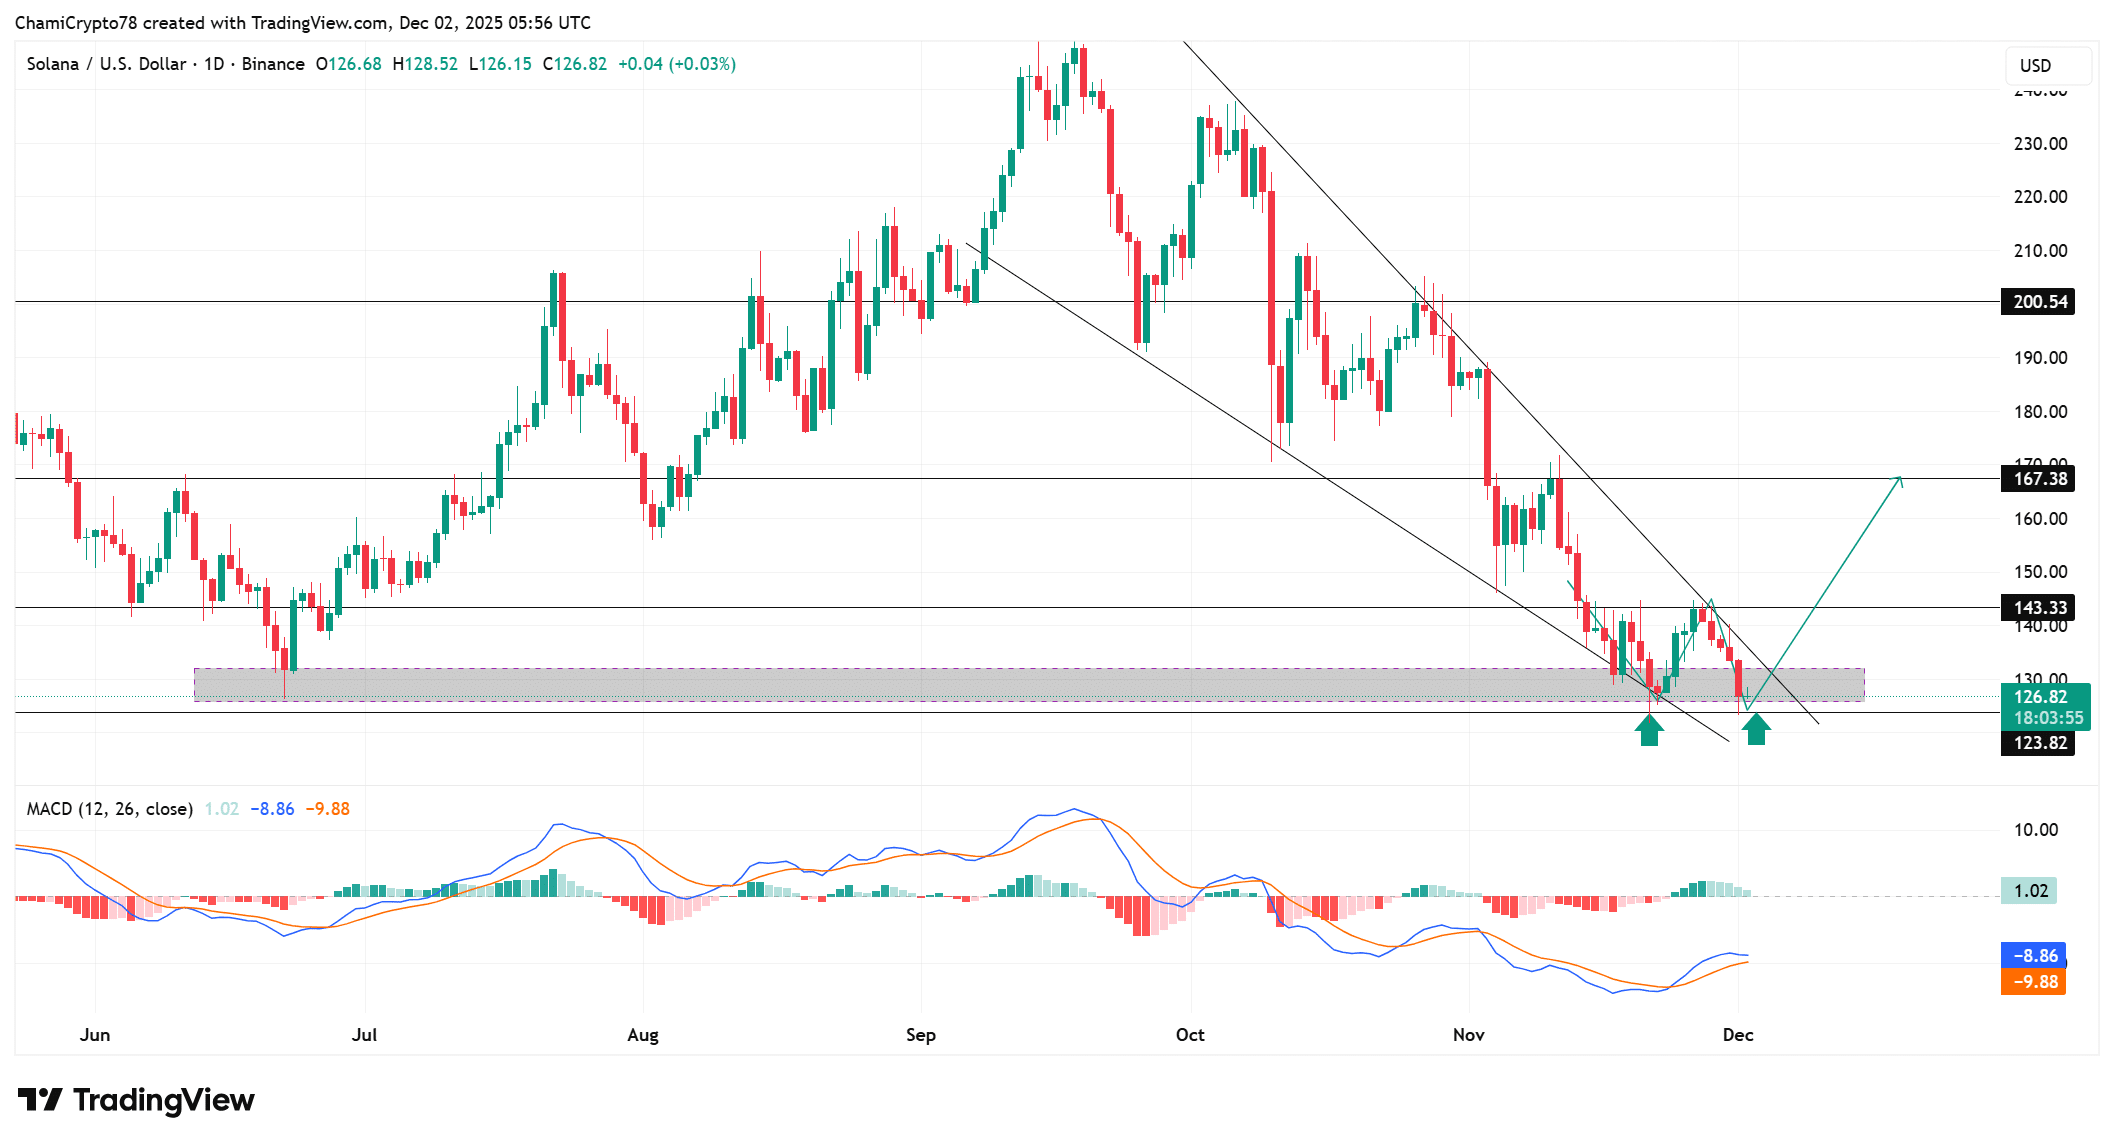
Source: TradingView
The falling wedge pattern compresses price action, with Solana testing lower boundaries while forming a double bottom that indicates resilient buyer interest. Higher lows in rejection strength show increasing defense of the $123–$130 region, potentially targeting $143.33 and beyond if the upper wedge line breaks. MACD’s upward curl adds technical confirmation, though a support breach would undermine this setup.
Source: CryptoQuant
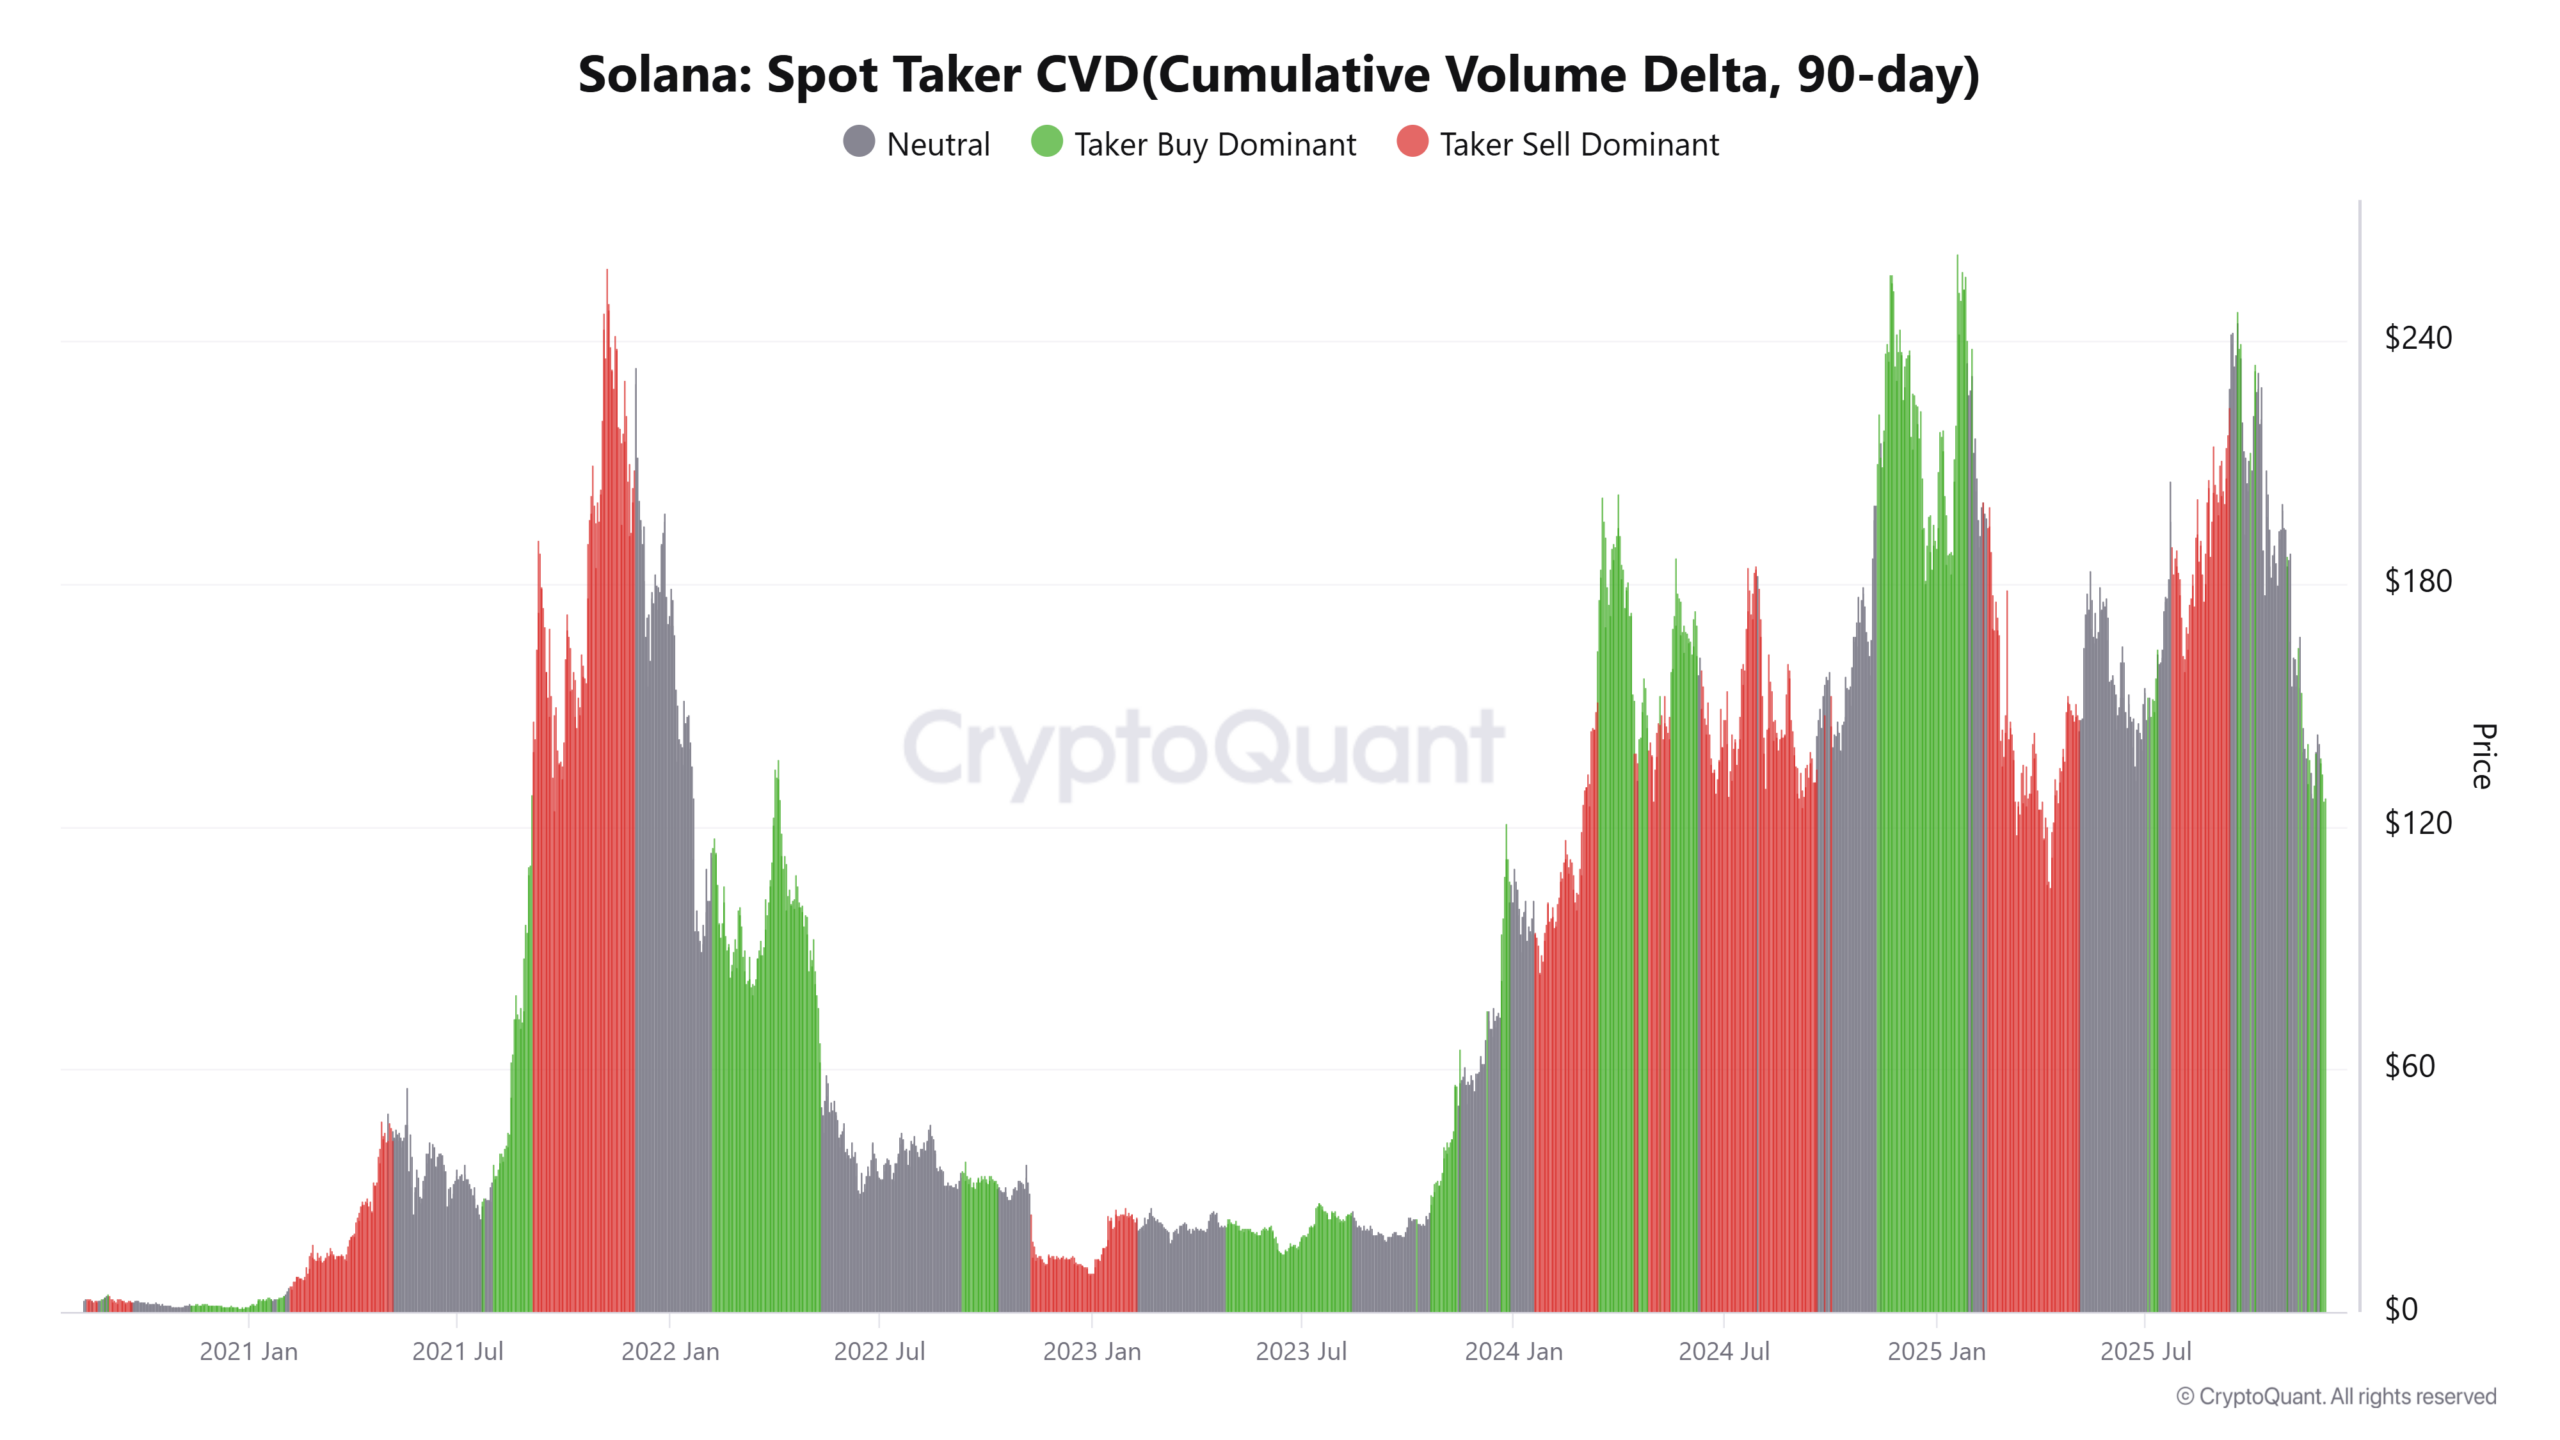
Buy-side aggression is evident in the rising 90-day taker buy CVD, where consistent absorption of sell orders aligns with the supportive double-bottom formation. This metric, tracked over medium-term flows, indicates active accumulation even at lower price boundaries, setting the stage for momentum shifts. Confirmation via higher lows would solidify this bullish trend, as rising buy pressure typically heralds stronger upward moves in volatile assets like Solana.

Source: CoinGlass
The elevated long bias in Solana’s positioning reflects growing trader confidence, with metrics pointing to a potential breakout as the wedge pattern resolves. This sentiment, coupled with on-chain data, underscores a shift from compression to expansion, provided volume sustains the move. Monitoring resistance breaks will be key to validating the rebound trajectory.
Key Takeaways
- Whale Activity Signals Accumulation: Transfers like 439,938 SOL from Coinbase highlight reduced supply and investor holding preferences, fostering rebound conditions.
- Technical Patterns Support Reversal: Falling wedge and double bottom formations, backed by upward MACD and CVD trends, indicate weakening bears and strengthening bulls near support.
- Bullish Sentiment Drives Momentum: An 80.21% long/short ratio encourages early positioning; sustain volume to target $143 and monitor for confirmed higher lows.
Conclusion
Solana’s rebound potential is fortified by whale accumulation, negative netflows tightening supply, and technical indicators like falling wedges signaling a shift in momentum. With buy-side CVD rising and a dominant long bias, the $123–$130 support zone serves as a critical pivot for upward expansion toward $143 or higher. As market compression eases, investors should watch for breakout confirmation to capitalize on this evolving bullish setup.
Comments
Other Articles
Solana Leads 2025 Revenue as Bulls Test $130 Resistance
January 1, 2026 at 10:32 AM UTC
Bitwise Files for 11 Altcoin ETFs Including AAVE, UNI Amid SOL, XRP Muted Gains
December 31, 2025 at 08:47 PM UTC
Ethereum Whales Trim ETH Longs and Pivot to BTC in Dec 31 On-Chain Rebalance Update
December 31, 2025 at 01:27 PM UTC