UNI Price Hovers at $5.92 Support: Potential Recovery or Further Decline Ahead
UNI/USDT
$24,124,416.21
$3.451 / $3.355
Change: $0.0960 (2.86%)
+0.0026%
Longs pay

Contents
Uniswap (UNI) price has corrected sharply from $10.3 to around $5.92 support level, showing bullish structure on daily charts but bearish signals on shorter timeframes. Swing traders may consider buying if $5.92 holds, though further downside risks persist amid negative funding rates and capital outflows.
-
Uniswap token rallied to $10.3 on UNIfication proposal and buyback plans, but retraced as predicted to test $5.92 support.
-
Daily timeframe maintains bullish bias after breaking $8.6 swing high, supporting potential recovery.
-
Lower timeframes indicate bearish dominance with Chaikin Money Flow below -0.05 and flat open interest, signaling seller control and possible drop below $5.92.
Uniswap UNI price analysis reveals mixed signals post-correction: bullish daily structure vs. bearish short-term indicators. Explore recovery potential and key levels to watch. Stay informed on DeFi trends—read on for expert insights.
What is the outlook for Uniswap UNI price after recent correction?
Uniswap (UNI) price experienced a swift rally to $10.3 earlier this month, driven by the UNIfication proposal and UNI buyback initiatives, but has since retraced to hover just above the critical $5.92 support. Technical analysis on the daily timeframe reveals a persistent bullish structure following the breach of the $8.6 swing high, suggesting potential for recovery if this support holds. However, shorter-term charts show conflicting signals, with bearish pressures from capital outflows raising the possibility of further declines.
How do technical indicators influence UNI price trends?
On the 1-day chart, Uniswap (UNI) maintains a bullish bias, as evidenced by its position above key moving averages and the recent breakout above $8.6. According to data from TradingView, the price action confirms this upward structure, with momentum indicators like the Money Flow Index (MFI) showing increased buying pressure in recent sessions. However, the 4-hour timeframe paints a more cautious picture, where the Chaikin Money Flow (CMF) has lingered below -0.05 since November 20, indicating significant capital exiting the market and reinforcing seller dominance. Expert analysts from platforms like TradingView note that such divergences often precede volatility, with UNI’s open interest remaining flat over the past three days and funding rates occasionally turning negative, pointing to bearish sentiment among derivatives traders. The spot Cumulative Volume Delta (CVD) has risen modestly in the last 48 hours, but not sufficiently to counter the week’s prior selling pressure, per Coinalyze metrics. This setup underscores the need for UNI to defend $5.92 to sustain bullish hopes, as a breach could target lower supports around $5.
Uniswap [UNI] rallied swiftly to reach $10.3 earlier this month, on the back of the UNIfication proposal and UNI buyback plans.
An COINOTAG report earlier this month observed that, based on the price action, it was likely that Uniswap token prices could retrace to $6.86 and $5.92.
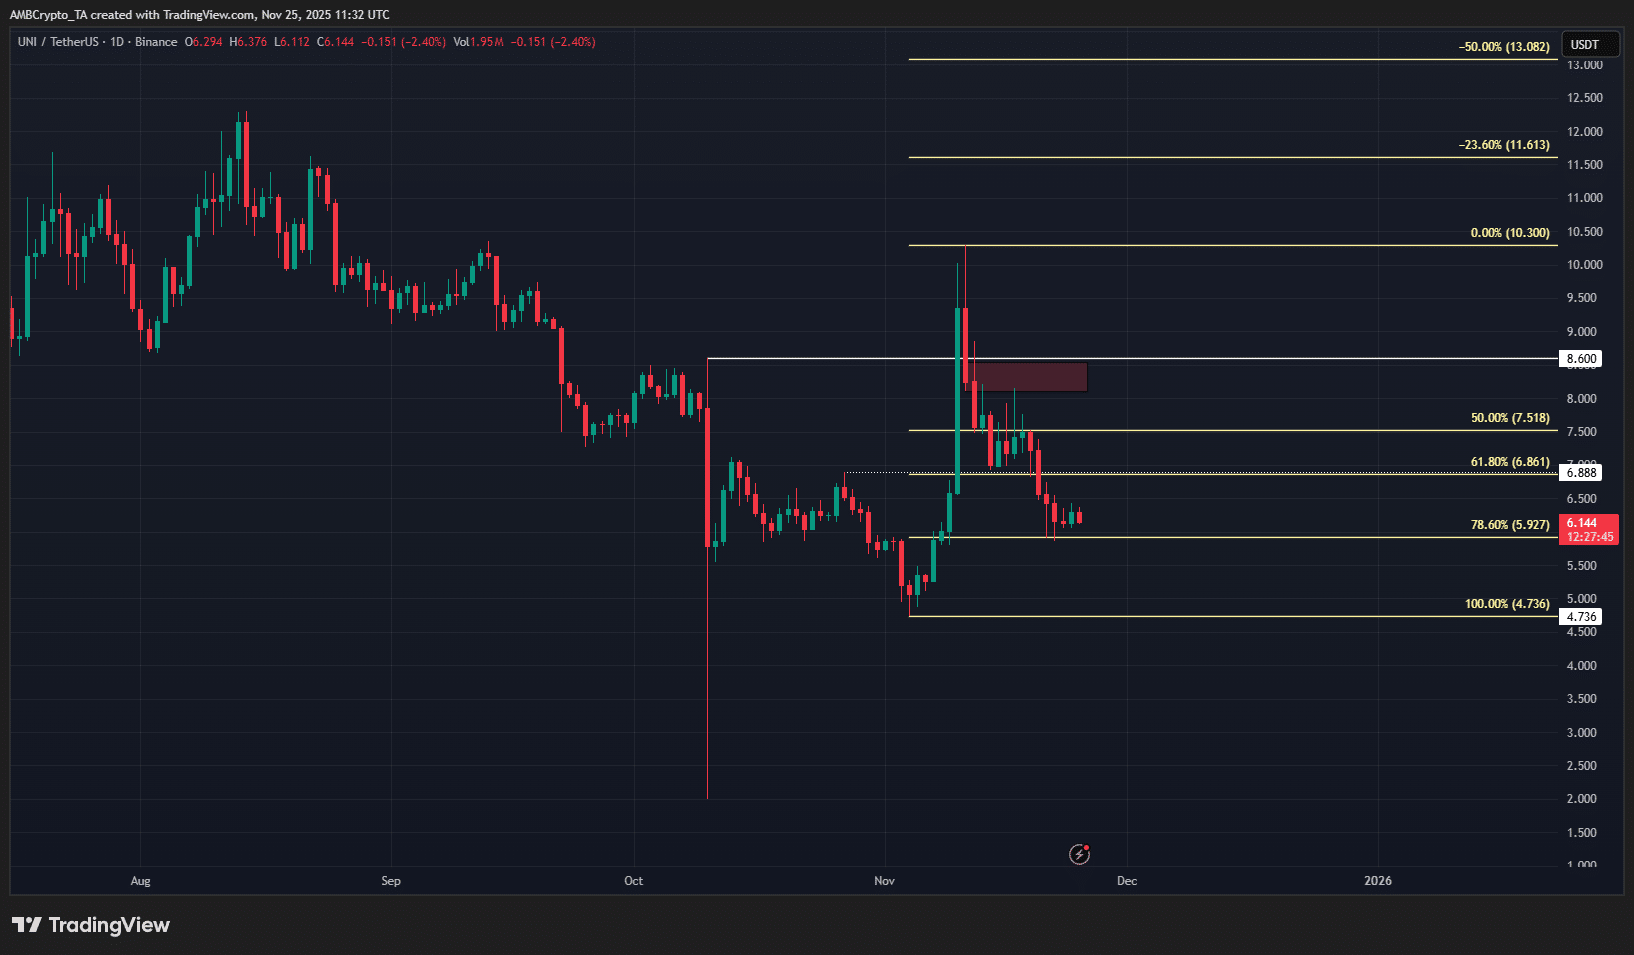
Source: UNI/USDT on TradingView
This has come true, and at the time of writing, UNI was hovering above the $5.92 support.
From a technical analysis perspective, the 1-day timeframe continued to have a bullish bias. This was true since the breach of the swing high at $8.6 during the rally earlier this month.
In other news, the Uniswap Foundation called for the DeFi sector’s need for tax clarity and regulatory guidance in a post on X.
What next for UNI price trends?
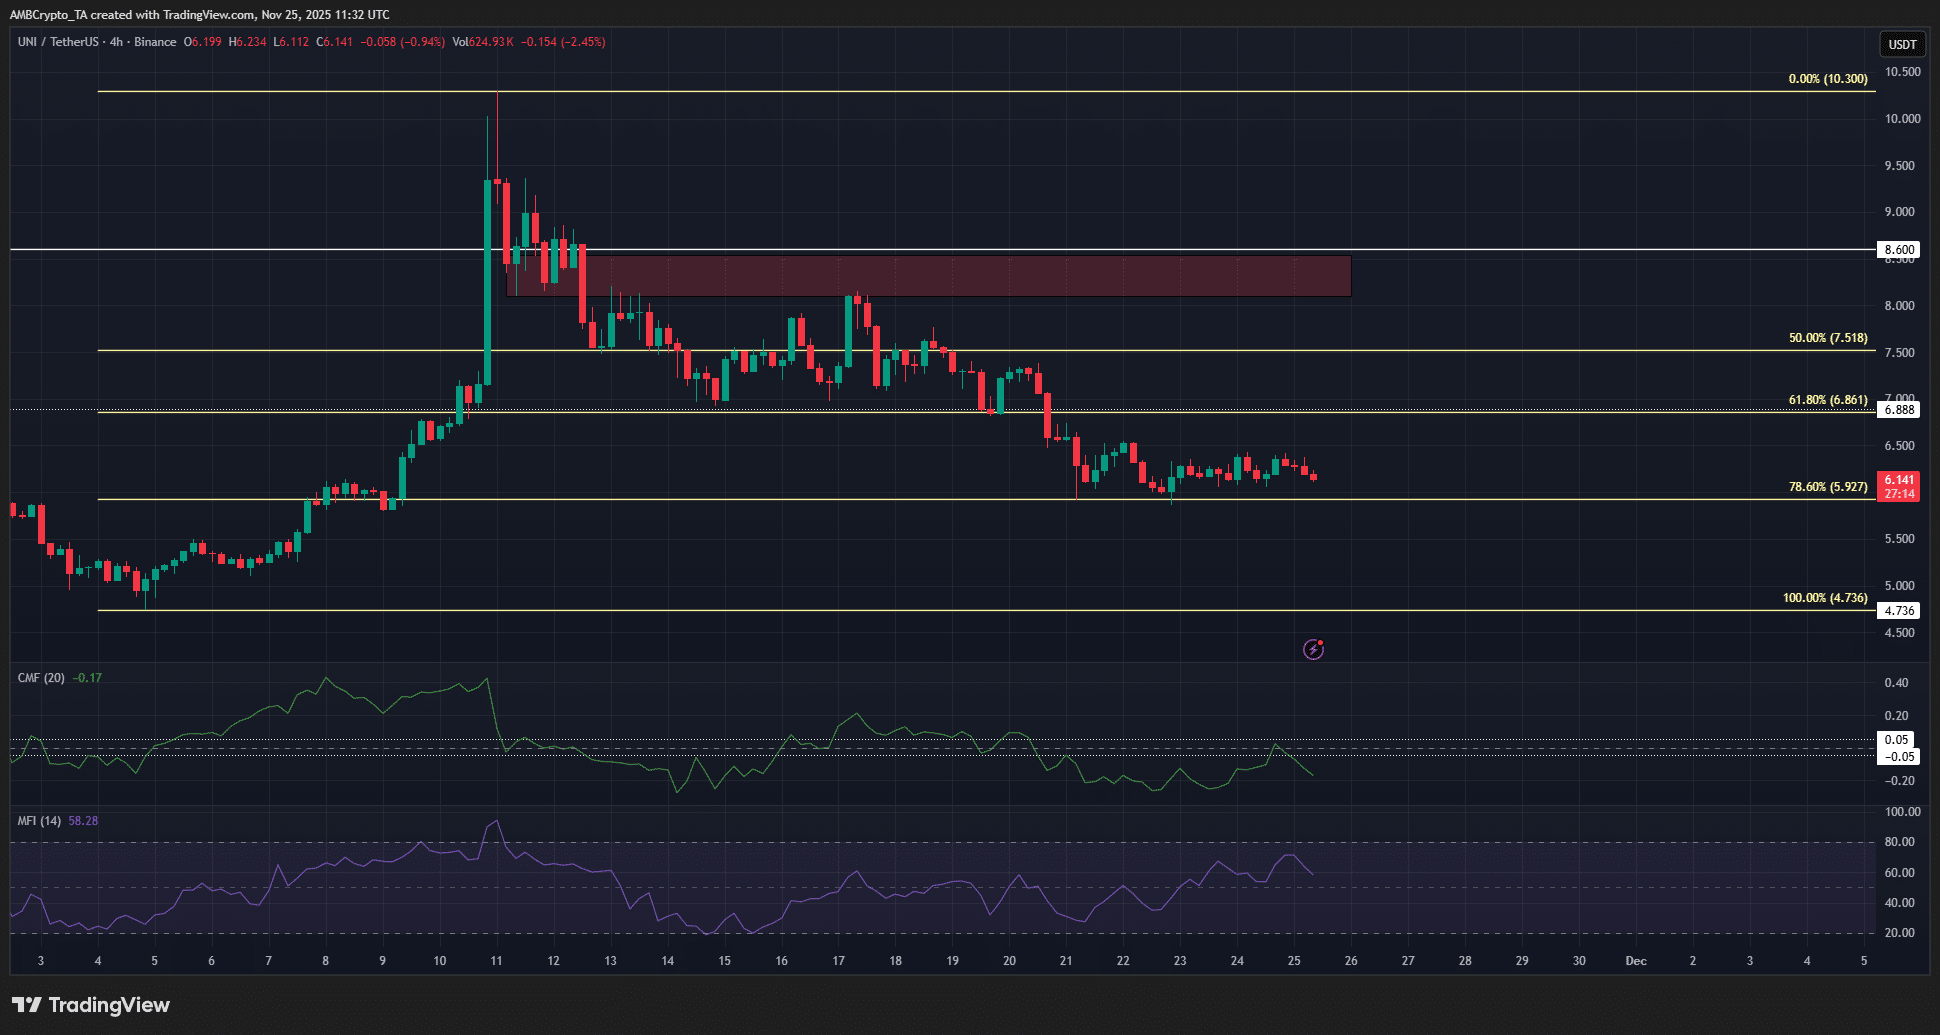
Source: UNI/USDT on TradingView
The 4-hour chart showed conflicting technical indicator signals. The MFI was above 50 to show increased buying pressure and upward momentum over the past few days.
In contrast, the CMF has been well below -0.05 to showcase sizeable capital flow out of the market since the 20th of November.
The H4 price structure was bearish, and has been this way for more than a week. The retest of the $8.6 supply zone before this bearish downturn meant that the sellers were in control.
Has the situation changed? Not likely.
Recovery or another leg down?
A move above $6.55 on the Uniswap token price would signal the onset of recovery, potentially encouraging entries from lower timeframe traders seeking momentum plays. Conversely, a decisive close below $5.92 would confirm ongoing bearishness, likely drawing UNI toward sub-$5 levels as sellers capitalize on the weakened structure. Data from derivatives markets further supports this bearish tilt, with open interest stabilizing at low levels and funding rates reflecting payments from longs to shorts, indicative of prevailing pessimism.
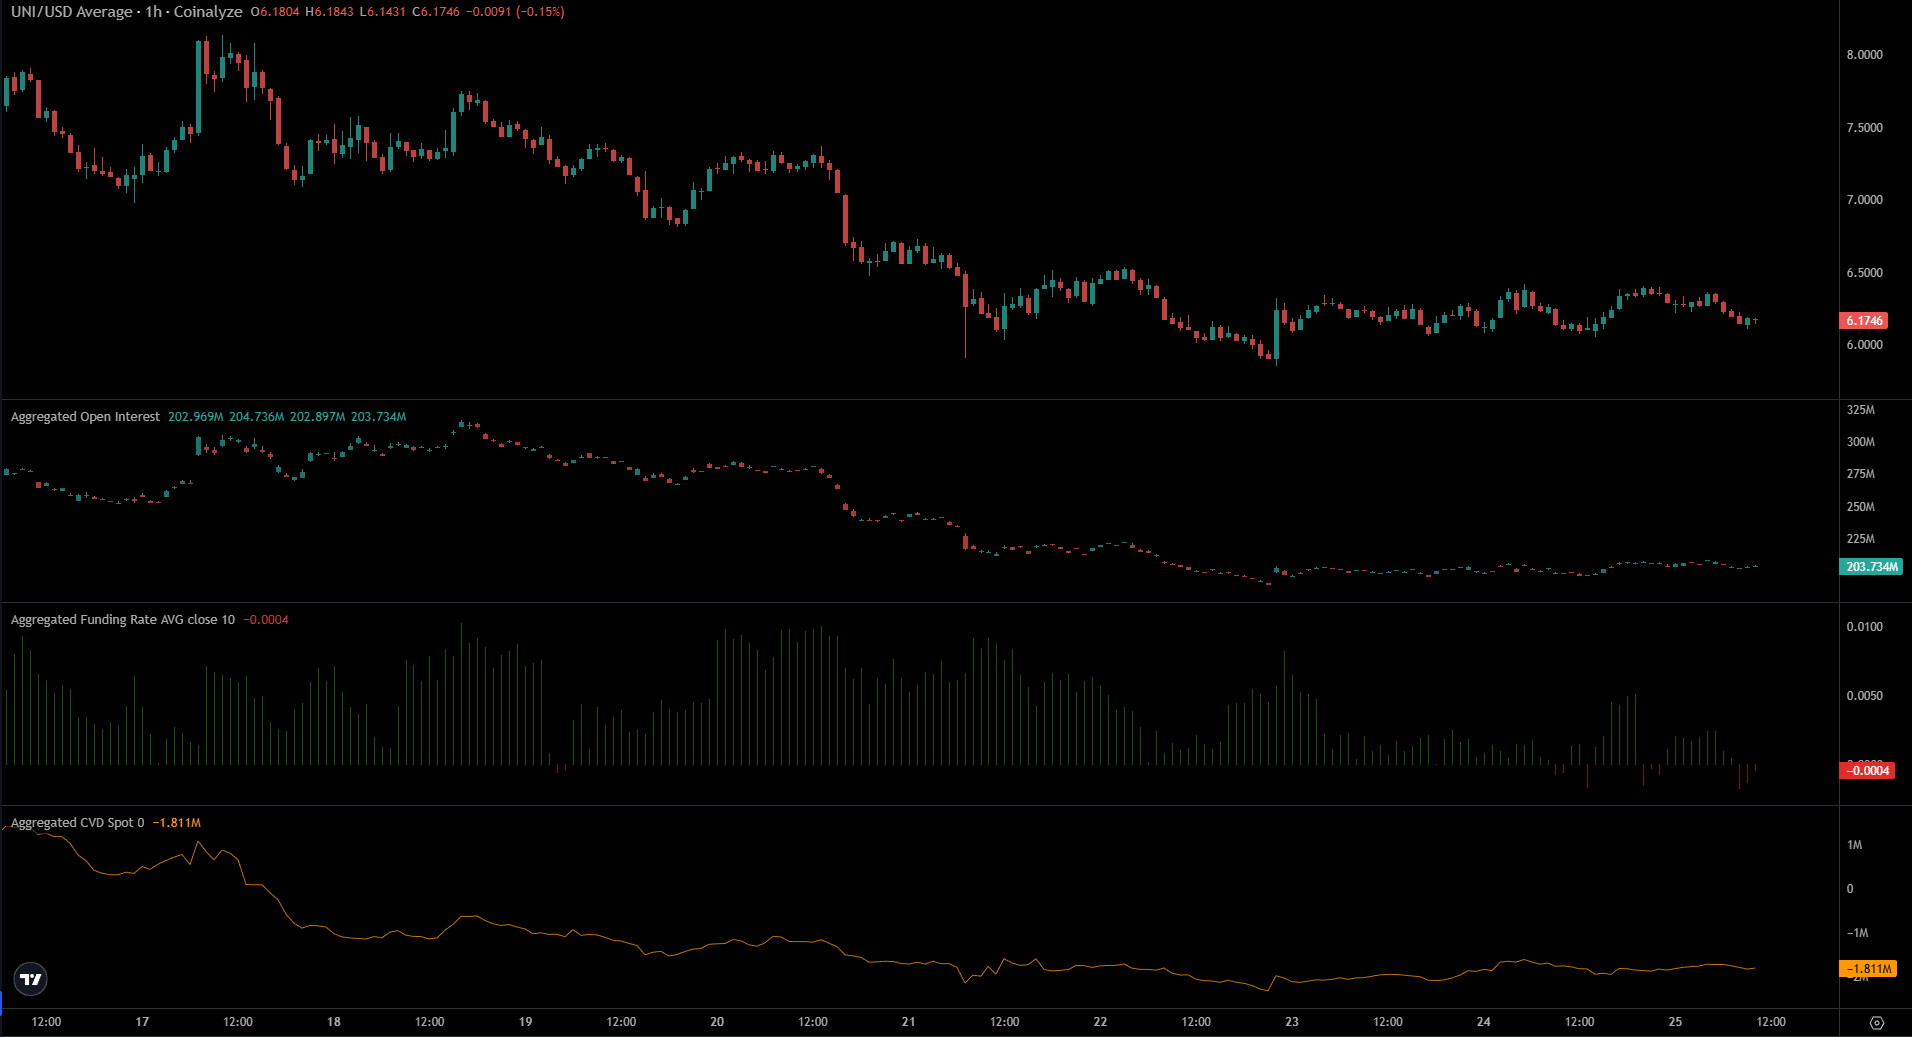
Source: Coinalyze
On the other hand, a UNI drop below $5.92 would signal continued bearishness.
That scenario appeared more likely, based on the evidence at hand.
Moreover, the Open Interest has been flat over the past three days, and the funding rate has occasionally dipped into negative territory.
This meant long positions were paid by short position holders, and indicated bearish sentiment. The spot CVD was rising over the past 48 hours, but not fast enough to undo the previous week’s selling.
The Uniswap Foundation’s recent advocacy for clearer tax policies and regulatory frameworks in DeFi highlights broader sector challenges that could impact UNI’s trajectory. As reported in foundation announcements on X, such guidance is essential for sustainable growth, potentially bolstering investor confidence if addressed. Technical experts emphasize monitoring volume profiles, where spot CVD’s gradual uptick offers a glimmer of hope but falls short against the bearish derivatives data.
Frequently Asked Questions
Is now a good time to buy UNI after the deep correction?
Swing traders might find opportunities to buy UNI on the daily timeframe’s bullish structure, provided $5.92 support remains intact to preserve upward potential. However, bearish indicators on lower timeframes suggest caution, as a break below this level could lead to further losses, based on current price action and market sentiment.
What are the key support and resistance levels for Uniswap UNI price?
The primary support for Uniswap UNI price sits at $5.92, with resistance at $6.55 and $8.6; holding above $5.92 could spark recovery toward $6.55, while a drop below risks testing $5, as indicated by recent TradingView and Coinalyze data for natural voice search responses.
Key Takeaways
- Bullish daily structure: UNI’s breakout above $8.6 supports long-term optimism if $5.92 holds firm.
- Bearish short-term signals: CMF below -0.05 and negative funding rates highlight capital outflows and seller control.
- Monitor key levels: A move above $6.55 signals recovery, but sub-$5.92 breach points to deeper correction—act based on confirmed breaks.
Conclusion
In summary, Uniswap UNI price analysis post-correction shows a tug-of-war between daily bullish bias and shorter-term bearish indicators like declining CMF and flat open interest, underscoring the importance of $5.92 support. With the Uniswap Foundation pushing for DeFi regulatory clarity, positive developments could aid recovery. Investors should stay vigilant on technical levels and market sentiment for informed decisions in this volatile landscape.
Disclaimer: The information presented does not constitute financial, investment, trading, or other types of advice and is solely the writer’s opinion.