

WLFI Signaled BTC Crash 5 Hours in Advance
BTC/USDT
$14,639,518,768.37
$66,956.15 / $65,240.78
Change: $1,715.37 (2.63%)
+0.0013%
Longs pay

According to Amberdata's new analysis, the DeFi governance token World Liberty Financial Token (WLFI), linked to the Trump family, experienced a sharp drop more than five hours before Bitcoin (BTC) on October 10, 2025, potentially signaling the market crash. That day, $6.93 billion in leveraged crypto positions were liquidated in less than an hour; BTC lost about 15%, Ether (ETH) 20%, and small tokens suffered losses up to 70%. Stress signals were seen in WLFI while BTC was still around $121,000.
The report examines three anomalies in WLFI: hourly volume spiking to $474 million (21.7 times normal) minutes after tariff-related news, the perpetual futures funding rate reaching 2.87% every eight hours (equivalent to 131% annually), and extreme deviation from BTC. WLFI's concentrated ownership structure and high leverage suggest it triggered liquidations in liquid assets like BTC and ETH. Researcher Mike Marshall told Cointelegraph that the five-hour lead is no coincidence but does not prove insider trading. He emphasizes that WLFI could be a leading indicator in market shocks.
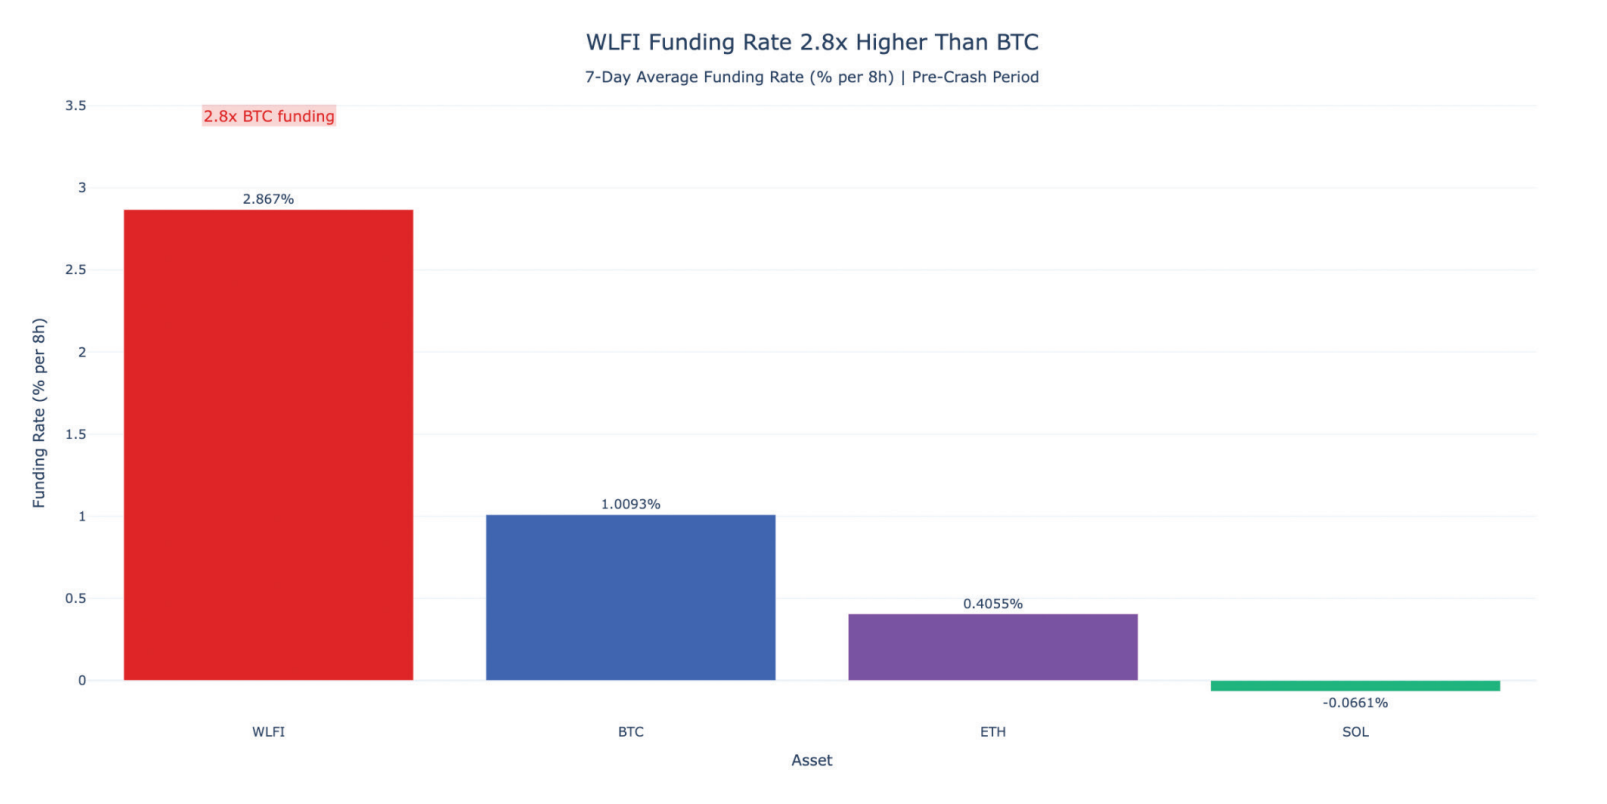
WLFI funding rating. Source: Amberdata
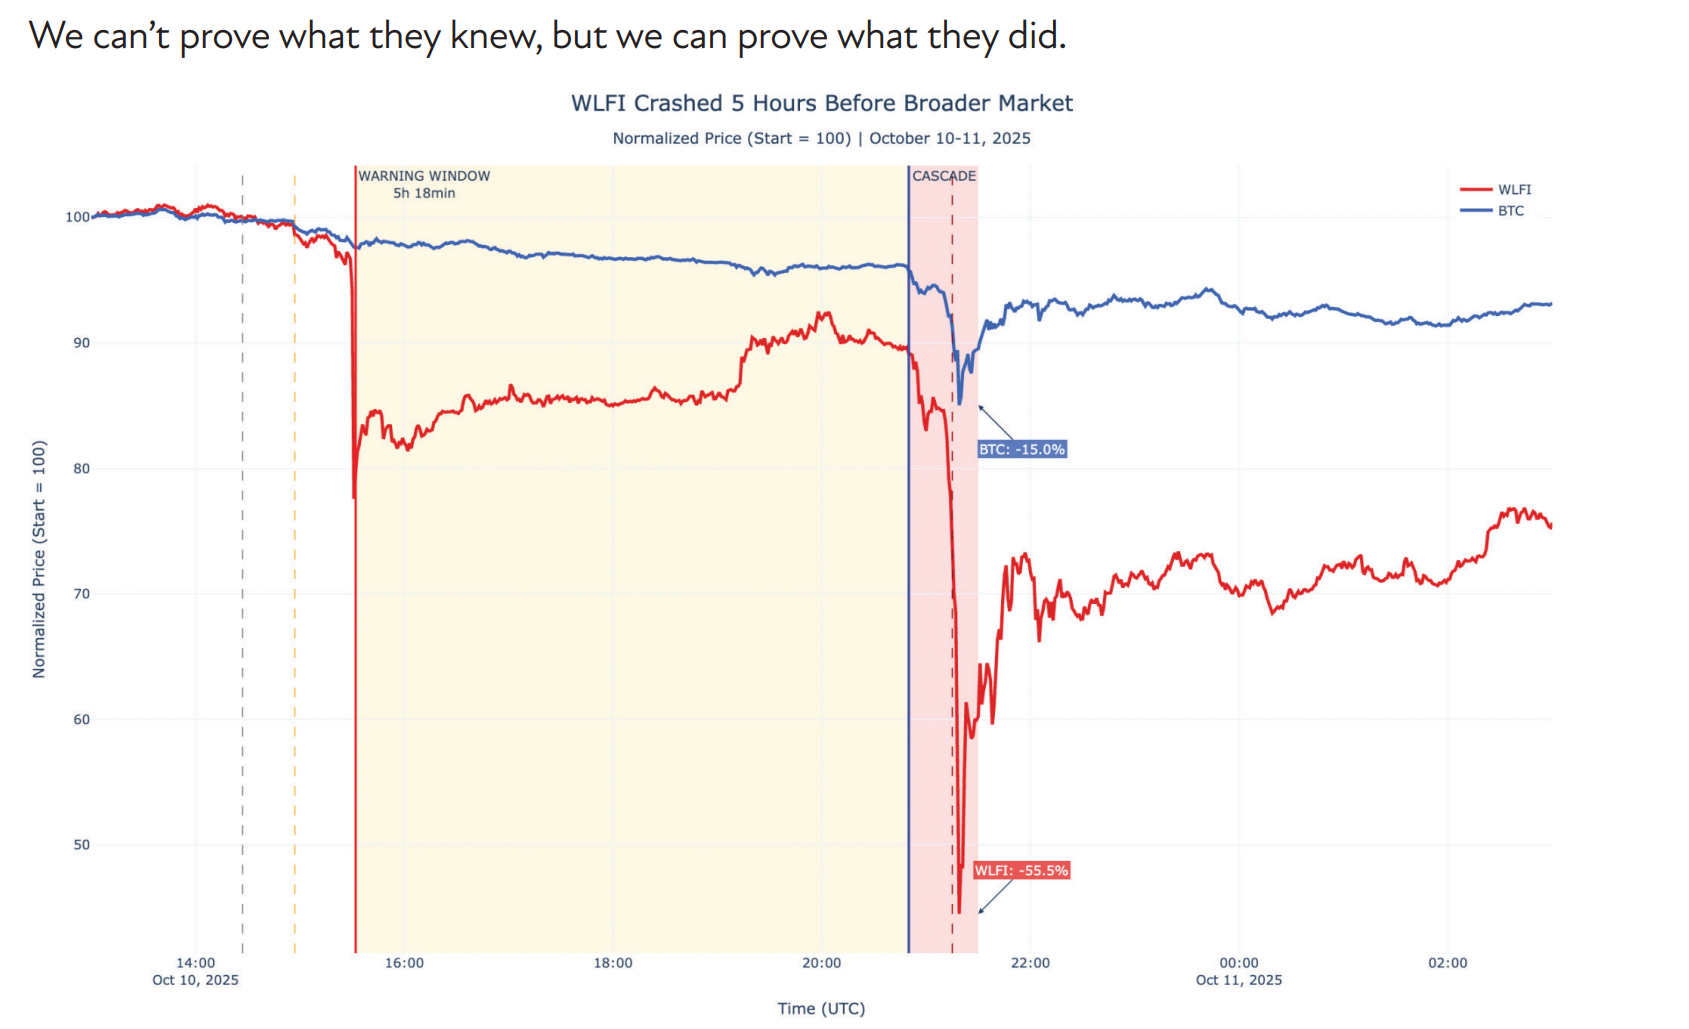
WLFI crashed ahead of Bitcoin. Source: Amberdata
Why Did WLFI Signal the BTC Crash in Advance?
According to the latest breakout news, BTC's weekly candlestick chart has turned positive and risen 8% from its lowest level. NYSE American has approved options listing for multiple crypto ETFs, which could bring new liquidity to the market. WLFI's highly leveraged structure appears to have triggered the liquidation wave before the BTC detailed analysis.
Critical Support and Resistance Levels for BTC
- Supports: S1: 60.000$ (Strong, 69% score, -12.96 distance)
- S2: 65.088$ (Strong, 62% score, -5.57 distance)
- Resistances: R1: 70.258$ (Strong, 80% score, +1.93 distance)
- R2: 78.145$ (Strong, 69% score, +13.37 distance)
BTC at 68.930$, RSI 36.26 (oversold), downtrend below EMA20 73.775$. Monitor BTC futures.
Frequently Asked Questions About BTC and WLFI
- Why did WLFI drop before BTC? Due to high volume, funding rate 2.87%, and leveraged positions.
- Will BTC break the $60,000 support? RSI is low, weekly recovery exists but downtrend dominates.
- Is WLFI a leading indicator? According to Amberdata, yes in market shocks, but it could be a coincidence.
The ETH detailed analysis also shows the liquidation impact.
COINOTAG does not provide financial advisory services. This content is for informational purposes only and should not be considered investment advice. Cryptocurrency investments involve high risk.
Add COINOTAG as a Preferred Source
Add COINOTAG to your preferred sources in Google News and Search to see our coverage first.
Add on GoogleRelated Tags
AI-generated, AI-reviewed, under COINOTAG editorial oversight.