XLM Poised for Possible Breakout Amid Recovery Signs and Resistance at $0.360
XLM/USDT
$75,523,721.00
$0.1649 / $0.1595
Change: $0.005400 (3.39%)
-0.0038%
Shorts pay

Contents
-
XLM is currently experiencing a recovery phase, yet significant resistance at $0.360 continues to present a challenge for traders.
-
The cryptocurrency has shown a moderate trading volume of 26.85M, indicating mixed investor sentiment within the Stellar community.
-
“The MACD crossover suggests an impending bullish phase if buying pressure intensifies,” according to analysts at COINOTAG.
Explore the latest trends in Stellar (XLM) as it attempts to navigate resistance levels, with insights on technical indicators and price predictions.
XLM Market Overview: A Range-Bound Performance
Over the past week, XLM has exhibited a varied performance, oscillating between $0.320 and $0.360. This price action comes after a brief downtrend, hinting at a potential rebound. The current trading price, at $0.344, indicates a cautious optimism among traders, particularly as numerous factors, including the broader crypto market conditions and Bitcoin’s performance, hold significant sway over XLM’s trajectory.
Amid a trading volume of 26.85M, market participants remain on alert for potential breakout opportunities while assessing underlying momentum. Analysts suggest that macroeconomic developments and regulatory news could also play crucial roles in influencing future price movements.
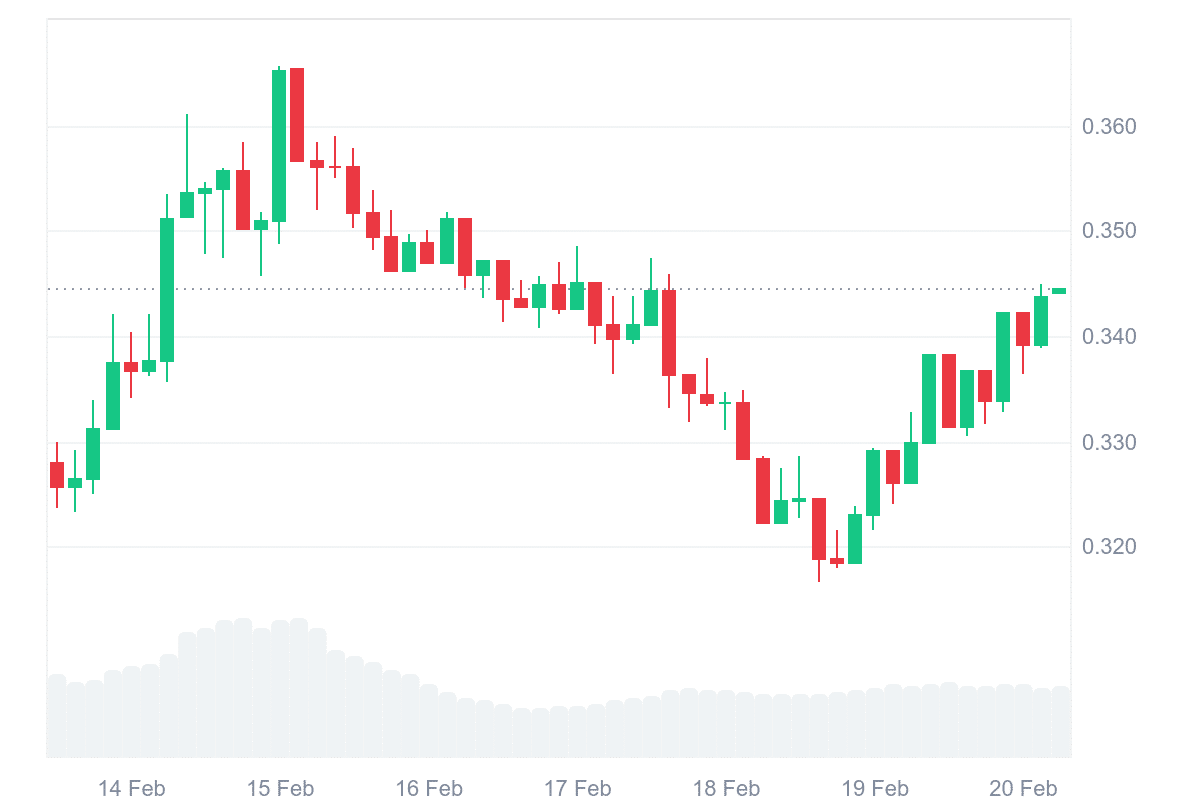
Source: CoinMarketCap
Technical Analysis: Cautious Optimism for Traders
Recent technical indicators reveal a cautious outlook for XLM. The formation of a bearish crossover between the 50-day and 200-day Moving Averages has caused traders to proceed with caution. Nevertheless, should XLM reclaim the 50-day MA level at $0.354, this could signify a break from its recent downtrend, potentially leading to increased bullish sentiment.
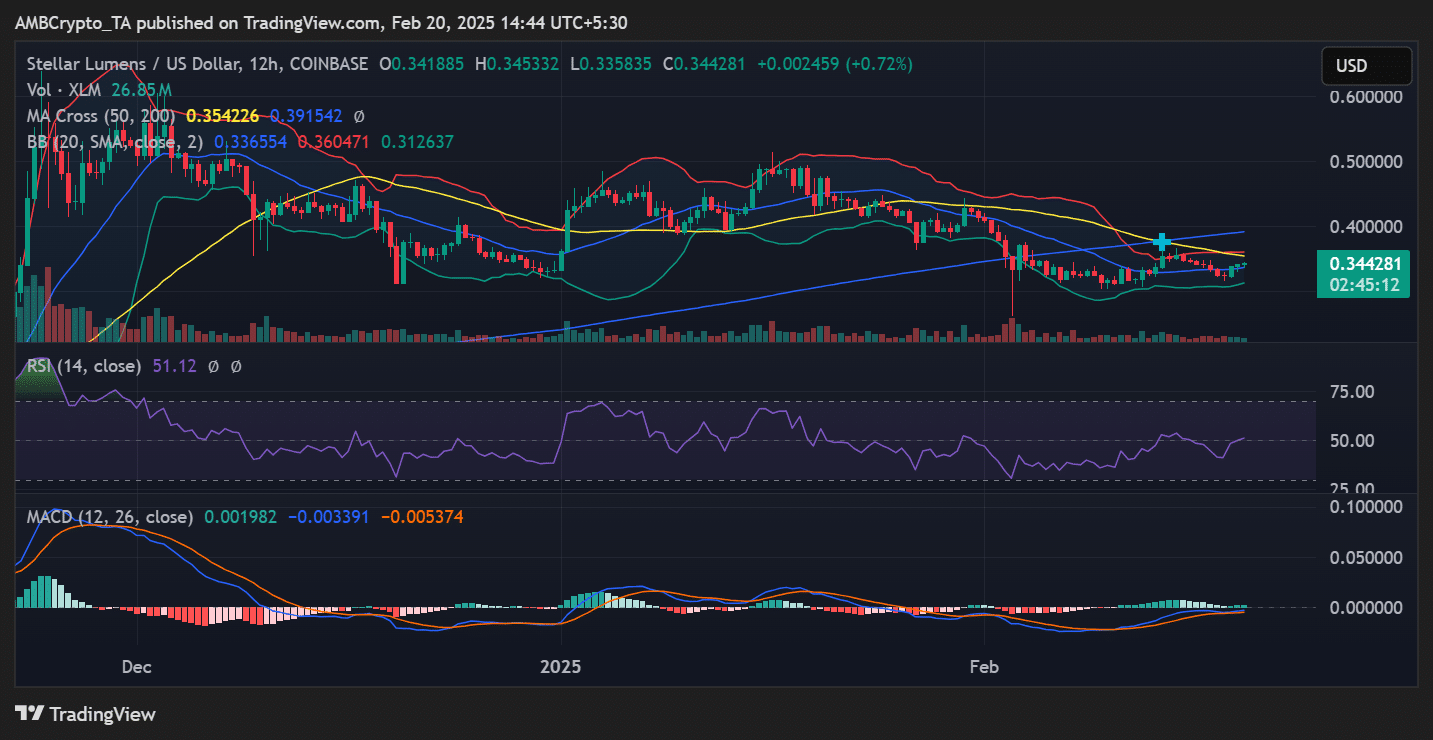
Source: TradingView
The current RSI stands at 51.12, reflecting a neutral market state, while conditions above 60 could confirm a more robust bullish trend. Additionally, the MACD appears to be on the verge of a bullish crossover, bolstered by green histogram bars, suggesting that buyers might drive XLM higher in the near future.
Furthermore, Bollinger Bands indicate an uptick in volatility. As the price approaches the 20-day SMA of $0.336, a breach above the upper band at $0.360 could trigger a significant upward movement.
Key Fibonacci retracement levels provide critical support and resistance clearances, with the 23.6% level at $0.341 and the 61.8% retracement at $0.301 marking vital zones to observe.
A successful jump above the $0.360 threshold could open pathways toward the $0.380 to $0.400 level.
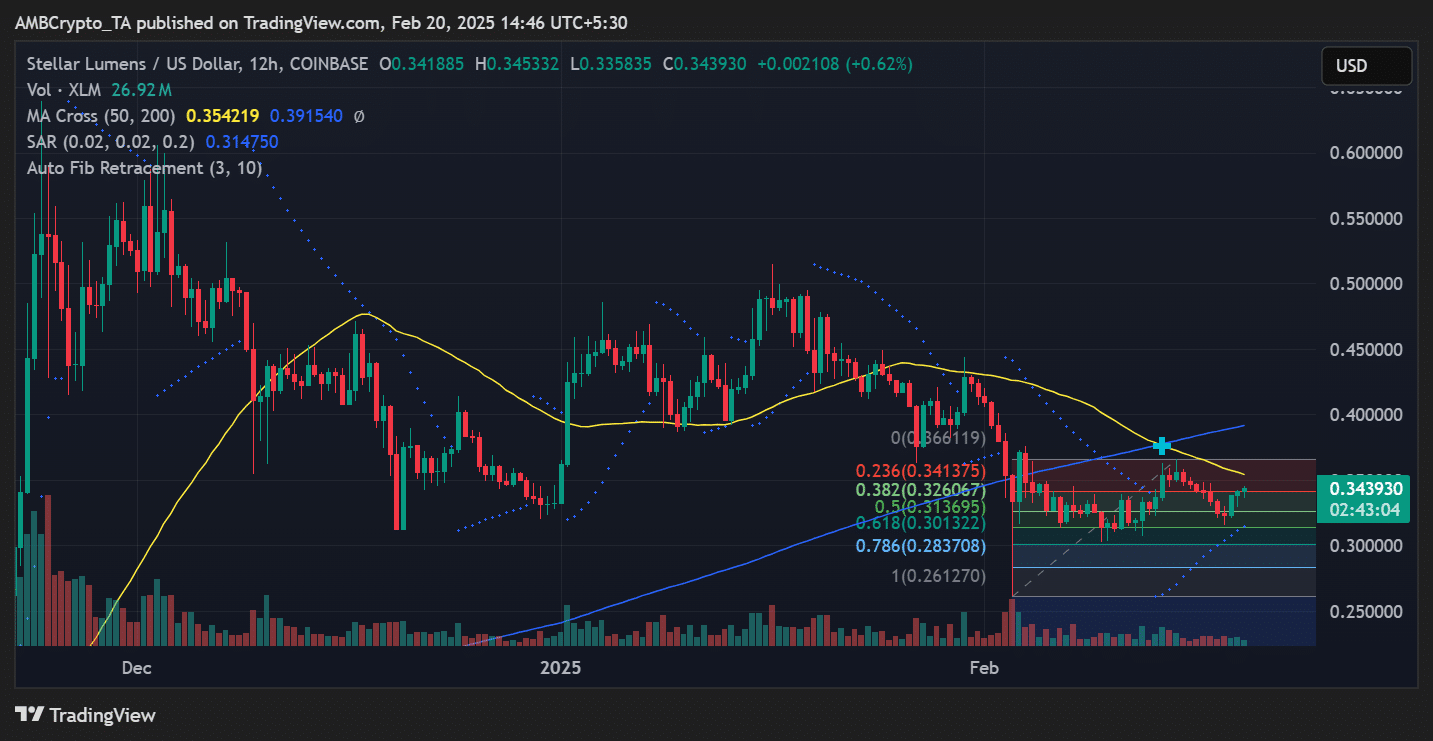
Source: TradingView
XLM Price Prediction: Analyzing Future Trends
Should XLM break above the significant resistance level of $0.360, the next targets for traders may include the $0.380-$0.400 range, particularly if momentum indicators like RSI and MACD support upward movement. Conversely, failure to maintain support above $0.320 could result in tests around $0.300-$0.283, corresponding with critical Fibonacci retracement levels.
The short-term outlook for XLM heavily depends on overcoming the $0.360 resistance while remaining above the 50-day MA. Traders are advised to monitor the evolving dynamics closely, focusing on market sentiment and volume trends for enhanced decision-making.
Overall, as momentum builds, a sequence of favorable developments could lead to a breakout scenario for XLM in the forthcoming trading sessions.
Conclusion
In conclusion, XLM’s ability to navigate resistance at $0.360 will be pivotal in determining its trajectory moving forward. Technical analysis points to both risks and opportunities, suggesting that market participants should stay alert to price movements and broader market trends that may impact future volatility and price direction.