XRP Price Analysis: Potential Drop Below $2 Amid Bearish Momentum
XRP/USDT
$526,675,977.20
$1.3584 / $1.3192
Change: $0.0392 (2.97%)
-0.0007%
Shorts pay

Contents
XRP price analysis reveals a retracement phase underway, with the token down 19% since October 27, 2025. Bearish momentum dominates daily and 4-hour charts, while the weekly structure remains bullish above $1.61, signaling potential support levels amid ongoing selling pressure.
-
XRP weekly chart shows bullish swing structure intact, with key support at $1.61.
-
Daily and 4-hour timeframes indicate bearish trends, with resistance at $2.7 holding firm.
-
Fibonacci retracement at $2.28 breached, RSI below 50, pointing to undervaluation but continued downside risk per on-chain data.
XRP price analysis highlights retracement risks and key support zones. Discover bullish weekly signals versus bearish short-term trends. Stay informed on XRP’s next moves for smarter trading decisions today.
What is the current XRP price trend?
XRP price analysis indicates the token is undergoing a significant retracement, having declined an additional 19% since October 27, 2025. This movement follows a period of heightened volatility, with late buyers facing underwater positions as bears maintain control. On-chain metrics, including a falling Network Value to Transactions (NVT) ratio, suggest XRP may be undervalued relative to transaction volume, yet price action continues to favor sellers in the short term.
What do timeframe charts reveal about XRP’s momentum?
The multi-timeframe XRP price analysis provides critical insights into the token’s trajectory. On the weekly chart, the overall swing structure remains bullish, with key swing lows at $0.486 and highs near $3.4 establishing a positive framework. A higher low has formed at $1.61, which serves as a pivotal support level; a breach below this could shift the long-term outlook to bearish. Fibonacci retracement levels from the recent impulse wave highlight vulnerability, as the 78.6% level at $2.28 has been lost to downward pressure. The Relative Strength Index (RSI) has dipped below the neutral 50 mark, confirming dominant selling momentum, while the On-Balance Volume (OBV) shows minimal decline, offering a slight bullish counterpoint amid the retracement.
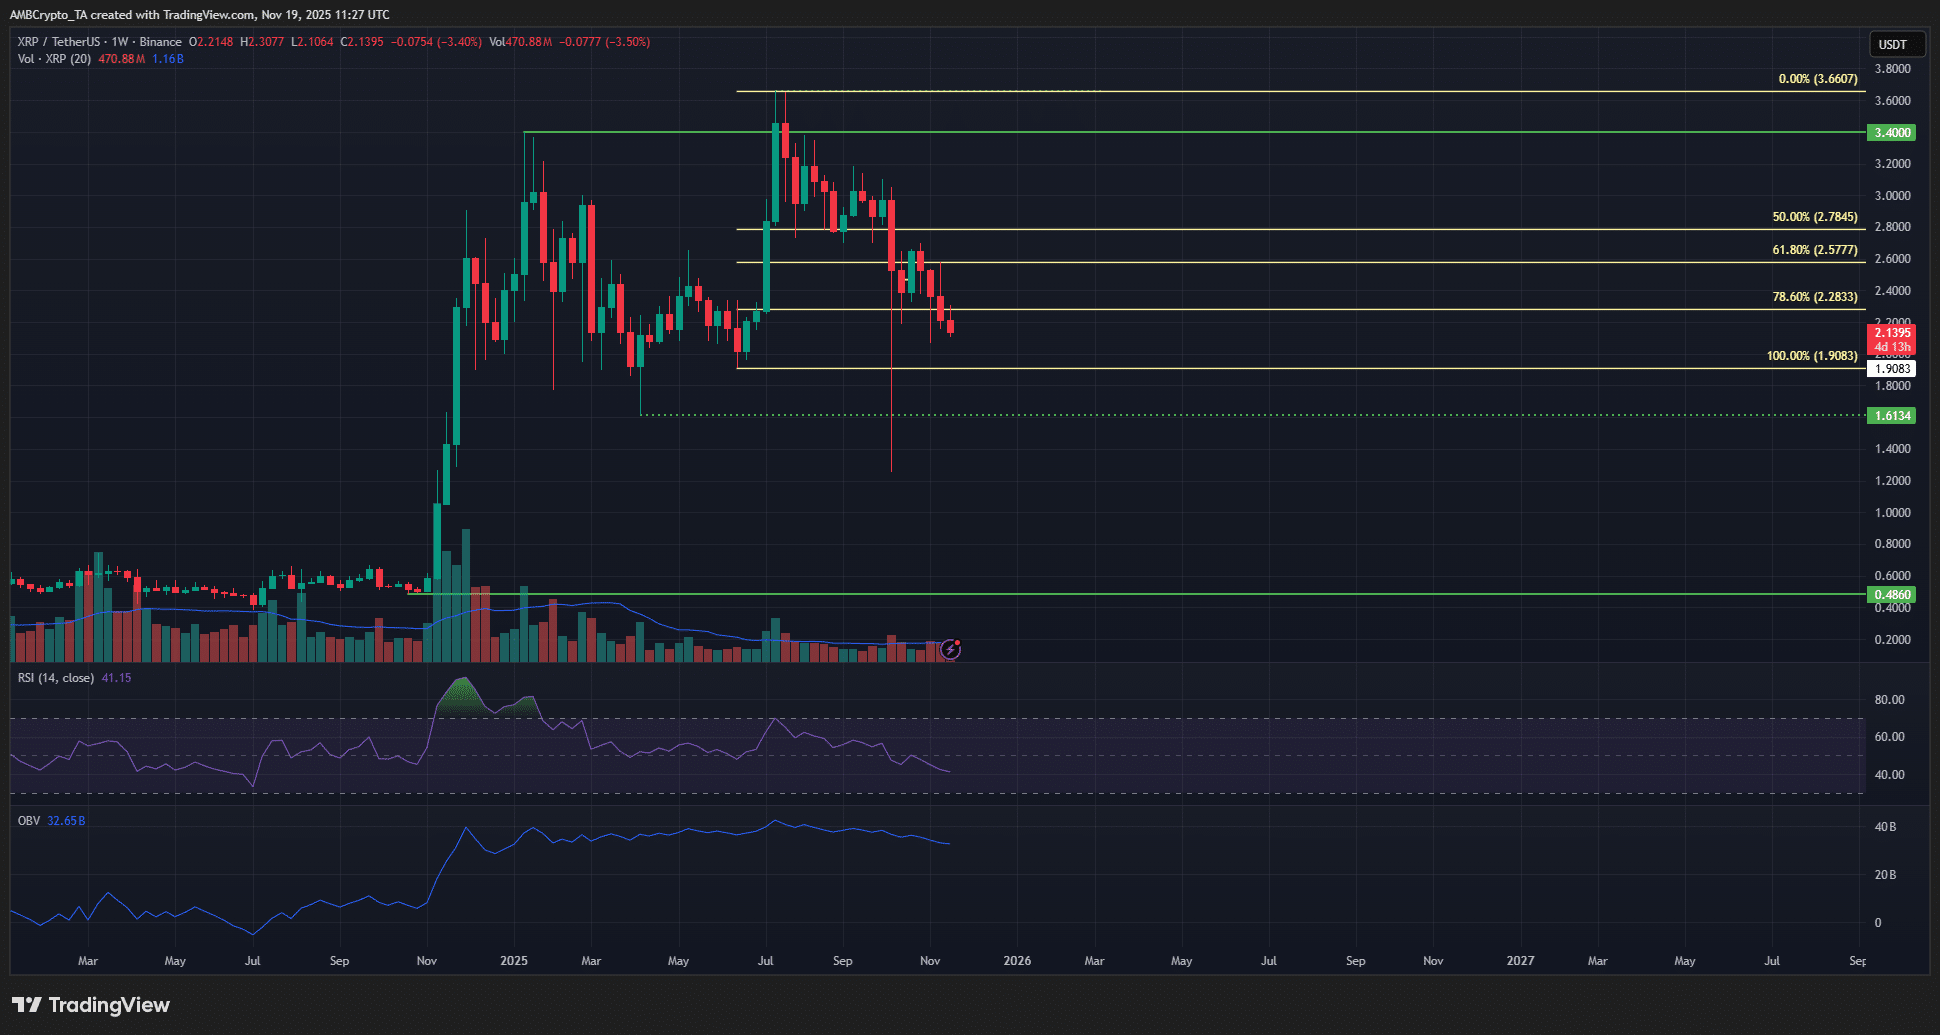
Source: XRP/USDT on TradingView
Shifting to shorter timeframes, the daily chart underscores bearish dominance in the XRP price analysis. The $2.7 zone acts as a formidable supply area, originating from an imbalance during the October 10 crash and repeatedly repelling upward attempts. The swing structure here is clearly bearish, with $2.06 identified as a critical swing point. A close below this level on the daily timeframe would solidify the downtrend’s persistence, leaving limited room for bullish recovery without fresh catalysts.
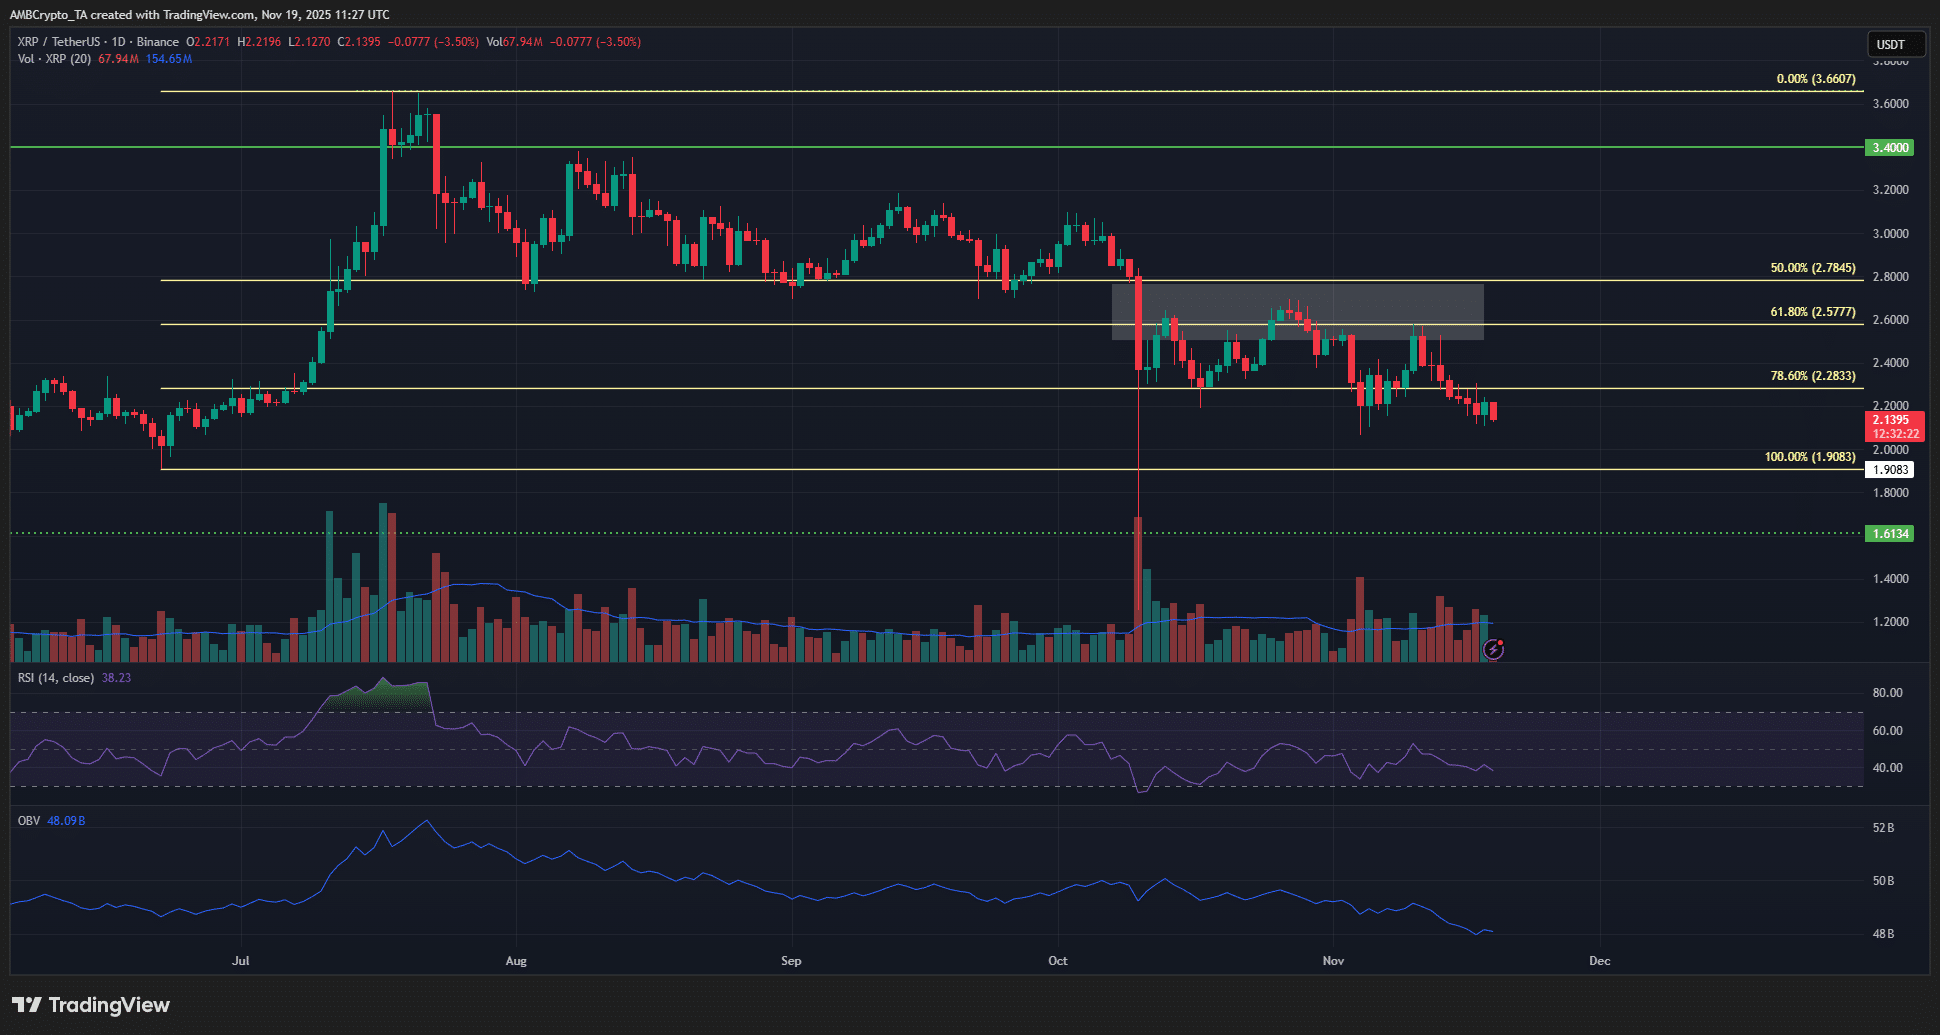
Source: XRP/USDT on TradingView
The 4-hour chart further reinforces the defensive posture required for bulls in this XRP price analysis. The $2.06-$2.15 range functions as a vital bullish bastion, where a rebound could reignite recovery prospects. Liquidity pools at $1.97-$2.01 present a strategic entry for longs, with stop-losses recommended just below $1.97 for risk management. Conversely, a 4-hour close under $1.97 or a daily close below $2.06 would validate the bearish continuation, prompting traders to adjust to short positions.
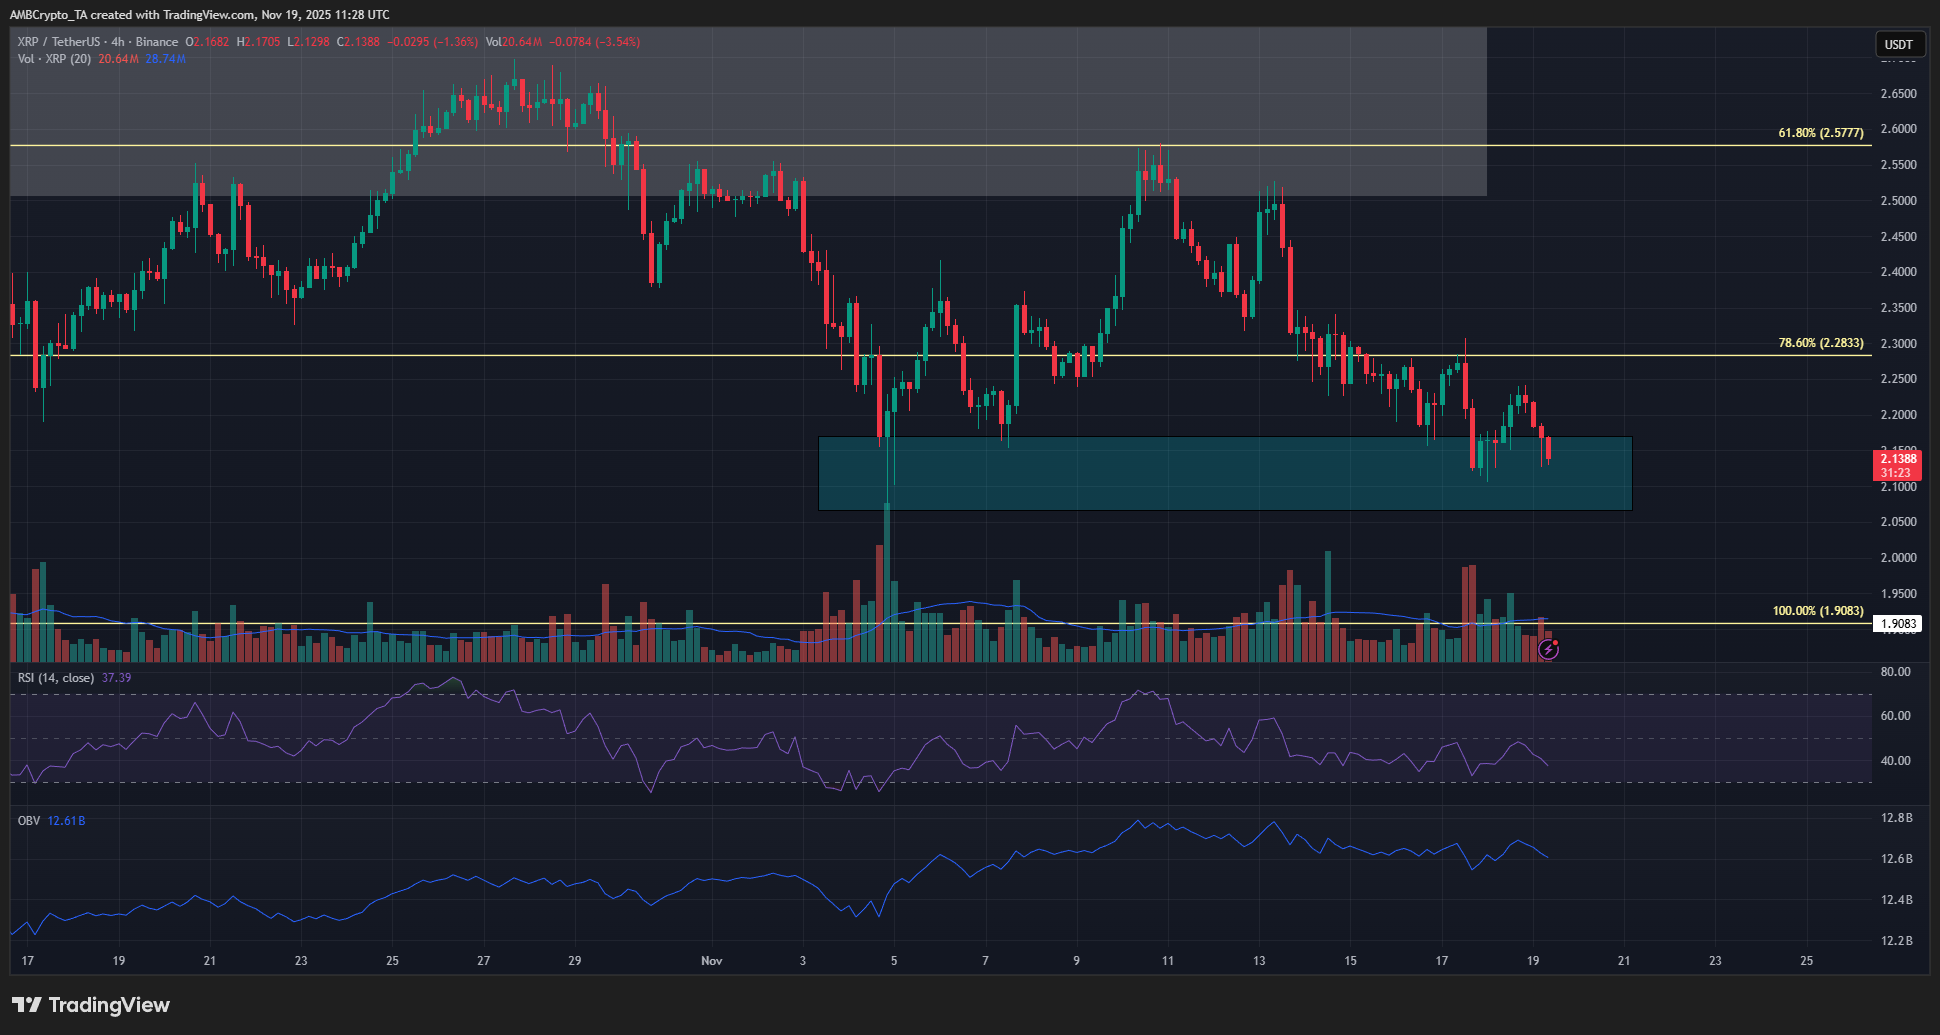
Source: XRP/USDT on TradingView
According to analysis from COINOTAG, this retracement has placed considerable stress on recent entrants, with many positions now in the red. The NVT ratio’s decline points to potential undervaluation, but without a shift in momentum, downward pressure persists. Market observers note that broader cryptocurrency trends, including Bitcoin’s influence, contribute to XRP’s current challenges, emphasizing the need for vigilance in XRP price analysis.
Frequently Asked Questions
What are the key support and resistance levels in XRP price analysis?
In XRP price analysis, primary support lies at $1.61 on the weekly chart and $1.97-$2.01 on shorter timeframes, while resistance holds at $2.7. A break below $2.06 on daily closes could accelerate declines, but holding these supports may signal stabilization for buyers.
Hey Google, is XRP showing signs of recovery in its current trend?
XRP’s short-term trend remains bearish with downward momentum on daily and 4-hour charts, but the weekly structure suggests potential recovery if it holds above $1.61. On-chain undervaluation metrics offer hope, though bears control the immediate outlook.
Key Takeaways
- XRP weekly structure is bullish: Higher low at $1.61 must hold to prevent a bearish shift, with Fibonacci levels warning of further retracement risks.
- Short-term bearish momentum: Daily chart resistance at $2.7 and potential closes below $2.06 confirm ongoing selling pressure on XRP.
- Trading opportunities with caution: Long entries near $1.97-$2.01 with tight stops; flip to shorts on breaks below key levels for risk-managed positions.
Conclusion
This XRP price analysis illustrates a complex landscape, with bearish signals on daily and 4-hour charts contrasting the resilient weekly bullish structure. As retracement pressures mount and on-chain data hints at undervaluation, traders should monitor $1.61 support closely. With Ripple’s ecosystem developments ongoing, staying updated on timeframe insights positions investors for informed decisions in the evolving crypto market.
Disclaimer: The information presented does not constitute financial, investment, trading, or other types of advice and is solely the writer’s opinion.
Comments
Other Articles
XRP’s Bullish Positioning May Weather $1B Escrow Release
January 1, 2026 at 06:02 PM UTC
XRP ETF Inflows and RWA Growth Signal Potential Amid Stagnant Price
January 1, 2026 at 10:47 AM UTC
XRP ETF Inflows Hit $1.16B as Standard Chartered Eyes $8 Potential Amid Whale Selling
January 1, 2026 at 04:48 AM UTC