XRP Short-Term Bounce Faces Bearish Long-Term Trend Amid Bitcoin Lift
XRP/USDT
$526,675,977.20
$1.3584 / $1.3192
Change: $0.0392 (2.97%)
-0.0007%
Shorts pay

Contents
XRP posted a 1.38% price gain in the past 24 hours amid Bitcoin’s recovery above the $90,000 level, despite a 0.85% weekly decline per CoinMarketCap data. This short-term bounce reflects broader market movements rather than sustained XRP demand.
-
XRP up 1.38% daily but down 0.85% weekly, signaling no short-term trend per CoinMarketCap.
-
Long-term holders realizing profits with Spot ETF inflows slowing, according to an COINOTAG report.
-
Bearish structure evident from October moving average crossover and On-Balance Volume failing to hit new highs.
XRP price bounce amid bearish trend: 1.38% daily gain tied to Bitcoin’s $90K surge. Examine charts, supports at $1.90-$1.61, and trader strategies. Monitor Ripple XRP for breakout cues now.
What caused the recent XRP price bounce?
XRP price bounce in the last 24 hours, registering a 1.38% increase, stems primarily from Bitcoin’s rebound above the $90,000 psychological resistance level. Pro-crypto lawyer Bill Morgan highlighted this connection, noting market-wide effects. Despite this lift, XRP remains down 0.85% over the week according to CoinMarketCap data, underscoring persistent short-term weakness.
Will XRP experience a bullish trend reversal soon?
XRP’s longer-term trend remains bearish following a moving averages crossover in October on the daily chart, as evidenced by data from TradingView. Buyers defended the $2.70-$2.75 support zone from August through late September, but it broke during the October 10 market crash. Subsequent lower highs confirm the downtrend structure. Weekly supports at $1.90 from June and $1.61 from April have weakened, with price recently dipping below $1.90 before attempting a reclaim. On-Balance Volume (OBV) has failed to reach new highs, indicating subdued demand and limiting bullish potential even if minor recoveries occur.
Examining the chances of a bullish trend change
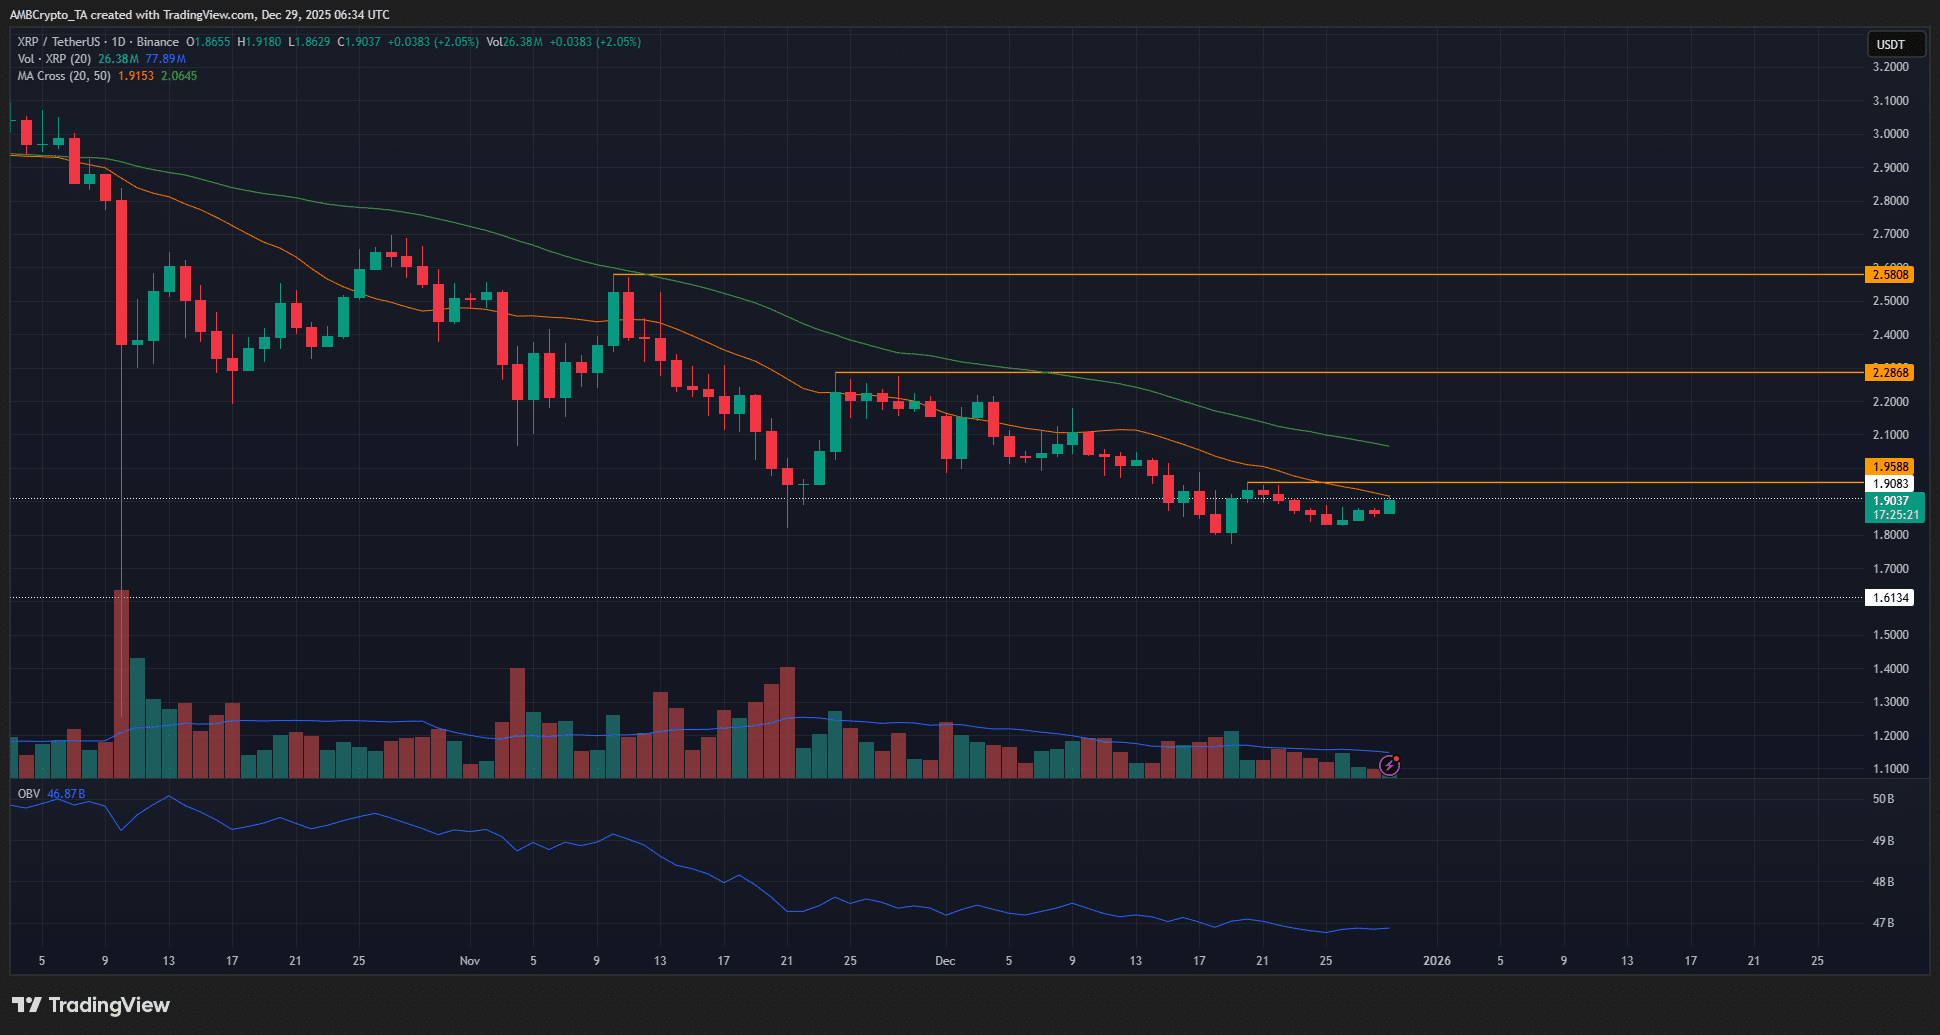
Source: XRP/USDT on TradingView
Frequently Asked Questions
Why is XRP showing weakness despite the daily price bounce?
XRP’s daily 1.38% gain masks deeper issues like long-term holders taking profits and declining Spot ETF flows, as detailed in an COINOTAG report. The bearish price structure with lower highs and weak OBV reinforces a lack of sustained buying interest.
What happens if XRP breaks above $2.05?
A decisive move by XRP past the $2.00-$2.05 supply zone, coupled with Bitcoin surpassing $94,500, could indicate a bullish shift. However, current demand metrics for both assets suggest this remains unlikely in the near term.
An COINOTAG analysis notes that even reclaiming $1.90 as support would not alter the swing trader’s bearish outlook due to overarching downtrend signals.
Key Takeaways
- XRP short-term bounce tied to Bitcoin: The 1.38% rise mirrors BTC’s push above $90K, per Bill Morgan’s observations, but lacks intrinsic catalysts.
- Bearish structure dominates: October’s MA crossover and OBV weakness confirm downtrend from $2.75 support breach.
- Sell rallies advised: Target $1.95-$2.00 for exits; invalidate shorts above $2.05 amid fading demand.
Traders’ call to action – Sell the bounce
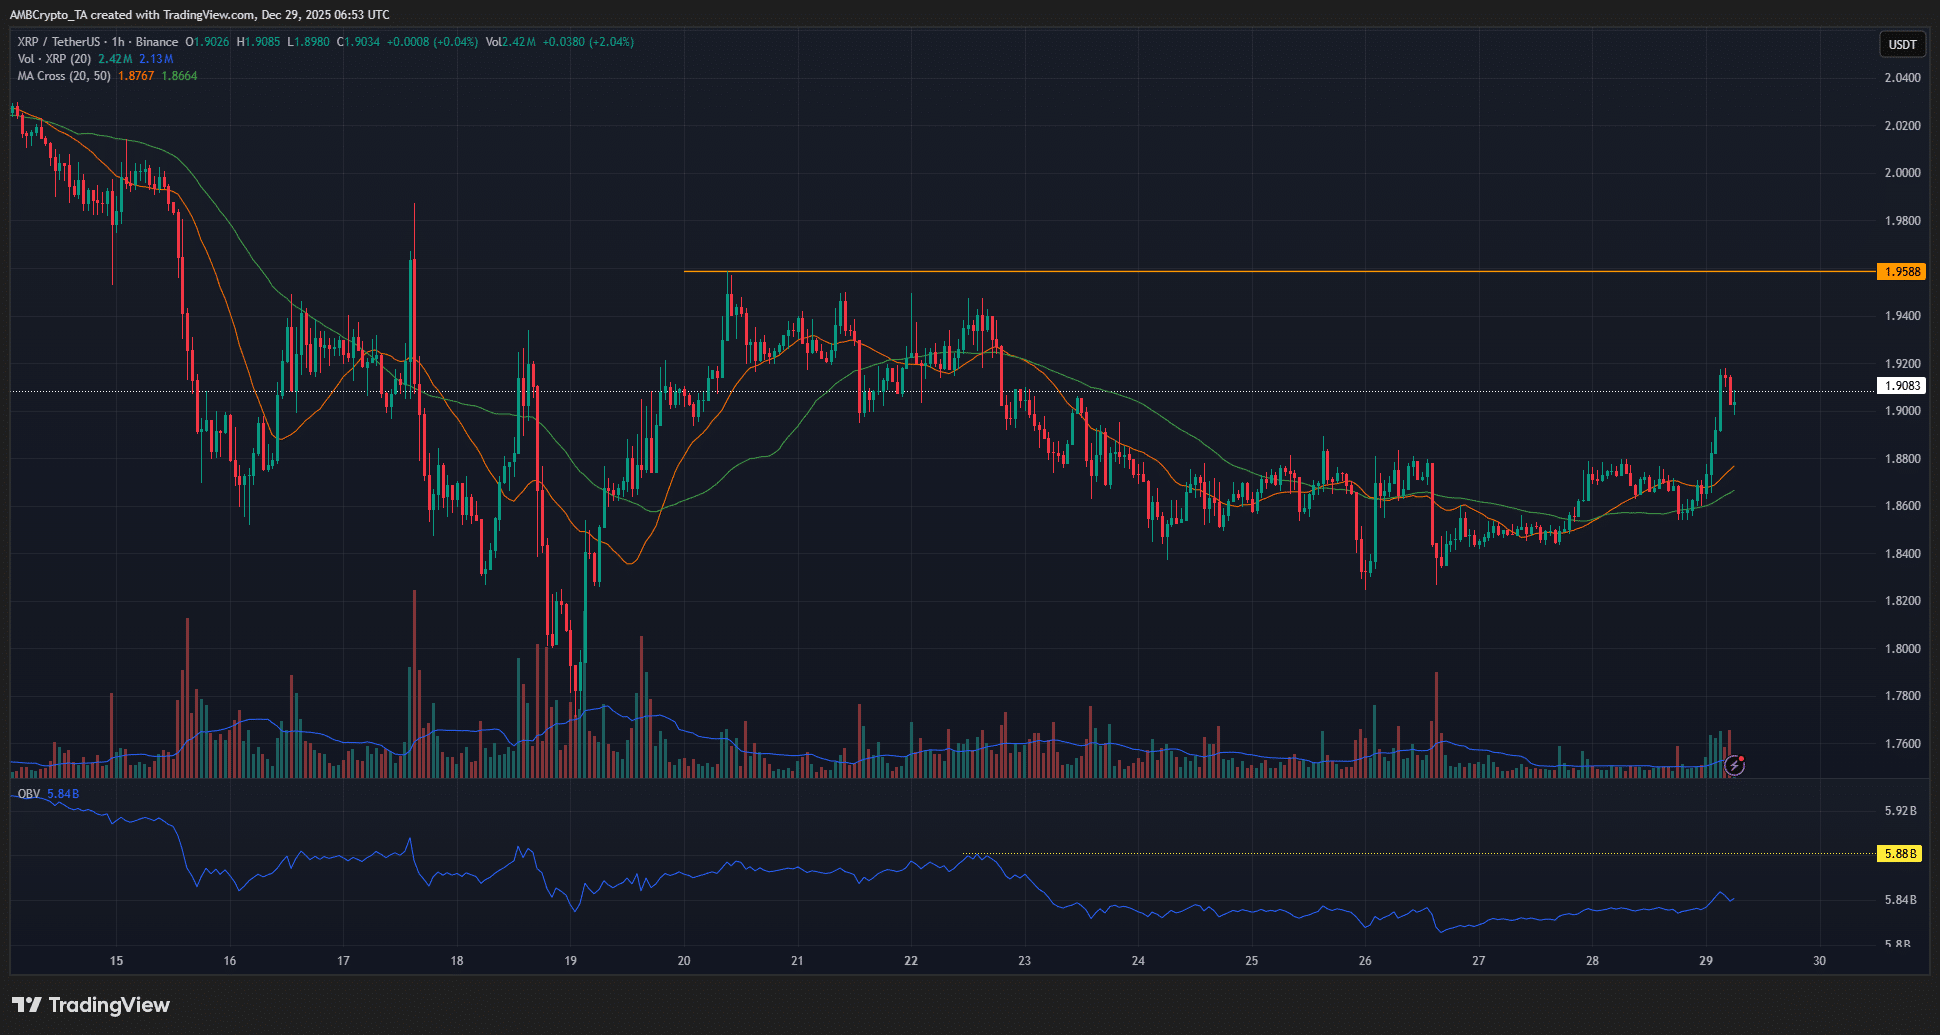
Source: XRP/USDT on TradingView
Continued low demand could cap buyer momentum, positioning any rally to $1.95-$2.00 as a sell zone. Short positions may suit traders, with stops above $2.05 for risk management. CoinMarketCap and TradingView metrics support monitoring these levels closely.
Conclusion
The XRP price bounce offers temporary relief amid a bearish trend marked by profit-taking and weak ETF flows. While Bitcoin’s influence drove the recent uptick, structural supports at $1.90 and $1.61 remain critical tests. Investors should prepare for potential downside, tracking OBV and BTC for reversal cues in the evolving XRP market.
Disclaimer: The information presented does not constitute financial, investment, trading, or other types of advice and is solely for informational purposes based on available data sources like CoinMarketCap and TradingView.
Comments
Other Articles
Bitwise Files for 11 Altcoin ETFs Including AAVE, UNI Amid SOL, XRP Muted Gains
December 31, 2025 at 08:47 PM UTC
Bitwise Seeks SEC Approval for 11 Altcoin Strategy ETFs Including Bittensor
December 31, 2025 at 05:21 PM UTC
Bitwise Files for 11 Crypto ETFs Including AAVE, NEAR, UNI Ahead of SEC Review
December 31, 2025 at 09:03 AM UTC