XRP Stabilizes Near Support with Potential Rebound as Institutions Add ETF Positions
XRP/USDT
$2,675,261,187.87
$1.5998 / $1.4387
Change: $0.1611 (11.20%)
-0.0016%
Shorts pay

Contents
XRP is stabilizing near critical support levels around $2.50, displaying signs of a technical rebound within a descending channel, while institutional ETF inflows of $15.82 million indicate strong accumulation during recent market dips, potentially signaling an upcoming bullish shift.
-
XRP trades in a descending channel with corrective A-B-C-D-E-F structure, eyeing a Wave 3 breakout to $3.4–$3.5 resistance.
-
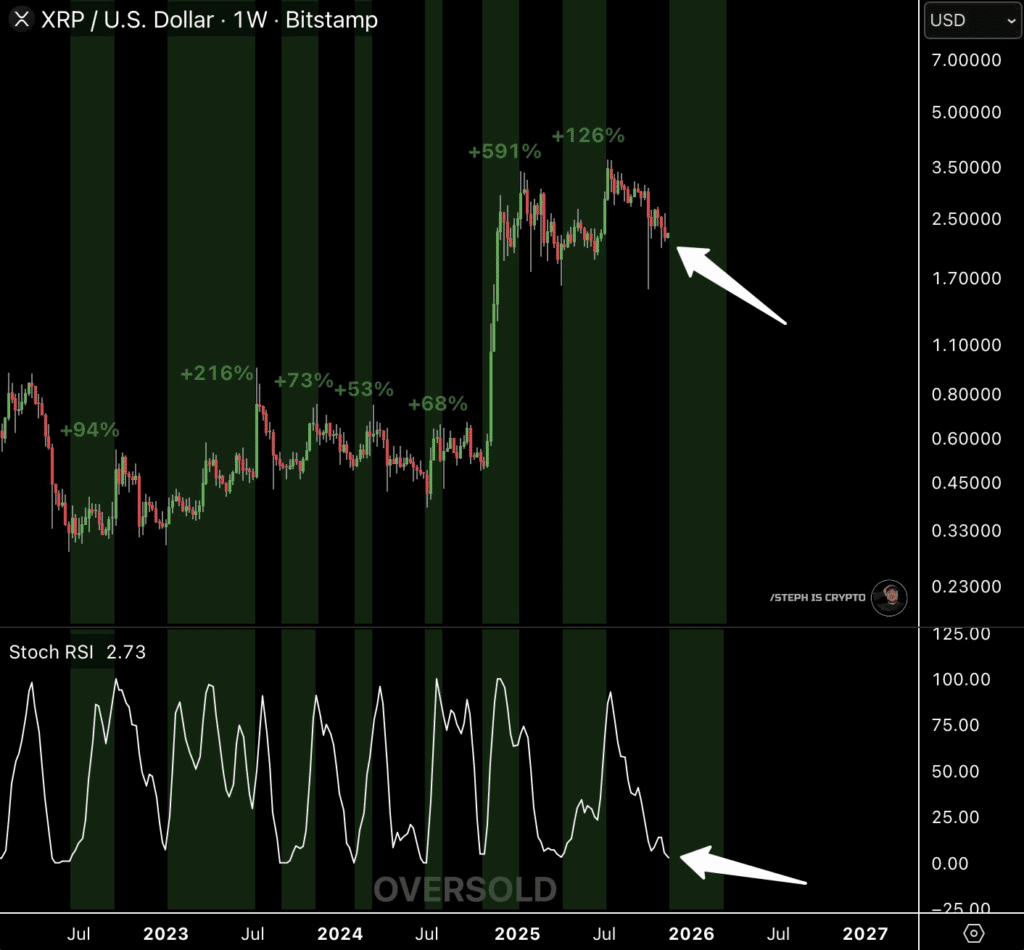
Weekly Stochastic RSI shows oversold conditions, mirroring past setups that led to significant rallies of up to 591%.
-
Institutional ETF positions grew by $15.82 million as of November 21, with 132 million XRP units held, reflecting confidence amid price weakness.
Discover XRP’s latest technical analysis showing rebound potential and institutional buying signals. Stay ahead in crypto with insights on price stabilization and ETF inflows—explore now for informed trading decisions.
What is the Current Technical Pattern for XRP?
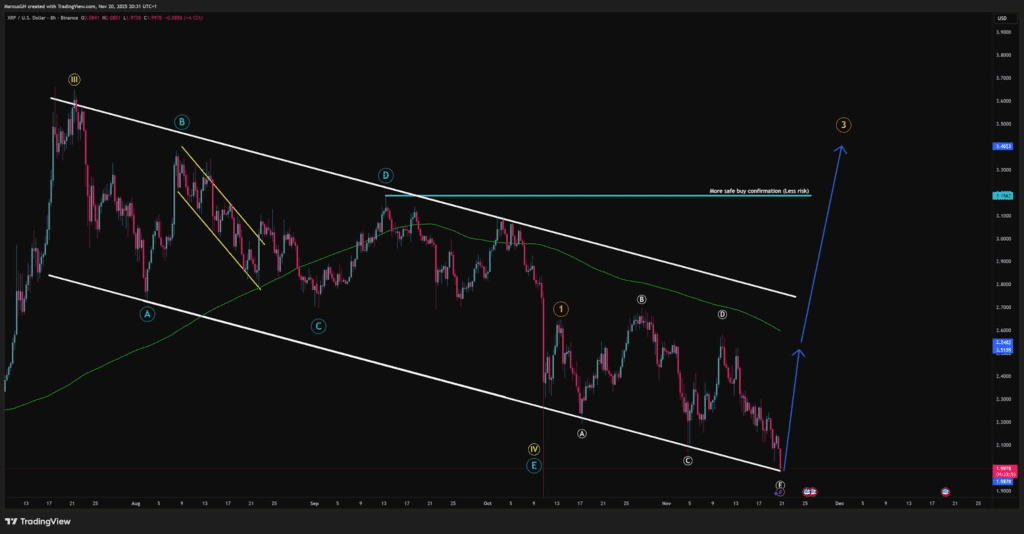
XRP’s technical pattern reveals a corrective structure within a descending channel, featuring swing points A through F that highlight accumulation phases against fading selling pressure. Recent price action has touched the lower trendline at point F, suggesting stabilization, while a break above the mid-channel average near $3.18 could confirm bullish momentum. This setup, analyzed via Elliott Wave theory, positions XRP for a potential impulsive Wave 3 advance toward $3.4–$3.5.
How Do Oversold Indicators Influence XRP’s Momentum?
The weekly Stochastic RSI for XRP indicates deep oversold conditions after a pullback from the $2.50–$2.70 range, a signal that has historically preceded multi-week rallies with gains from 53% to 591%, according to chart patterns observed in prior cycles. Green bands on weekly charts mark these cyclical opportunity zones where momentum resets, and current declining volatility suggests readiness for a reversal. As the Stoch RSI begins curling upward, it points to early bullish recovery, encouraging investors to monitor for stabilization before entry, supported by data from technical analysts like those at DustyBC Crypto.
XRP stabilizes near key support, showing technical rebound while institutions increase ETF positions during market dips.
- XRP trades within a descending channel, showing corrective structure and potential Wave 3 breakout toward $3.4–$3.5 resistance levels.
- Weekly Stochastic RSI signals oversold conditions, aligning with historical patterns that preceded multi-week and multi-month strong XRP rallies.
- Institutional ETF inflows of $15.82 million reflect a confident accumulation even with the recent price dips.
XRP is consolidating as the price move shows cautious activity, while technical signals and institutional inflows point to a possible change in market direction.
XRP Technical Analysis Reveals Corrective Pattern
XRP/USD remains within a defined descending channel marked by key support and resistance levels. Technical patterns indicate a prolonged corrective structure, with swing points labeled A–B–C–D–E–F reflecting accumulation phases.
Each lower boundary touch has shown progressively higher reactions, signaling exhaustion of selling pressure.Recent chart analysis points to price revisiting the lower trendline at point F, suggesting that downward momentum may be stabilizing.
A break above the mid-channel moving average could provide confirmation of bullish pressure returning. This level is marked as a potential “safe buy confirmation” zone near $3.18.
Source: DustyBC Crypto
The Elliott Wave framework projects a possible upward extension toward the $3.4–$3.5 area, representing Wave 3 potential. The wave formation indicates that if structural resistance is breached, XRP may transition from a corrective to impulsive phase.
Frequently Asked Questions
What Are the Key Support Levels for XRP in This Corrective Phase?
XRP’s key support in the current corrective phase lies near the lower descending channel trendline at point F, around $2.50, where historical bounces have occurred with increasing intensity. Breaking below this could extend the correction, but stabilization here aligns with Elliott Wave accumulation, offering a potential entry for long-term holders based on technical data from established analysts.
Why Are Institutions Buying XRP During Price Dips?
Institutions are accumulating XRP during dips because it presents value opportunities, as evidenced by $15.82 million in ETF inflows reported on November 21, with major holdings of 132 million units. This strategy diversifies risks while betting on XRP’s underlying blockchain strengths, making it a smart play for future growth in cross-border payments and digital assets.
Key Takeaways
- XRP’s Descending Channel Structure: Indicates a corrective A-B-C-D-E-F pattern with fading downside, setting up for a Wave 3 breakout if $3.18 is reclaimed.
- Oversold Stochastic RSI Signals: Historical precedents show rallies of 53% to 591% after similar resets, with current curl upward hinting at imminent reversal.
- Institutional ETF Inflows: $15.82 million added despite dips underscores confidence, advising investors to watch for stabilization before positioning.
Source: StephIsCrypto
Observing the Stoch RSI curling upward may indicate the early stages of renewed upward movement. Investors often watch for stabilization before taking positions in these zones.
Institutional Flows Show Continued Confidence
Institutional buying activity in XRP continues amid recent price dips. According to a Nov 21 report by Stephiscrypto, XRP received a $15.82 million ETF inflow despite declining prices.
Such inflows indicate institutions are acquiring XRP during market weakness.The same report highlights large concentrated positions in XRP, with 132 million units held, reflecting high conviction in the asset.
Diversification is also observed with smaller holdings in Solana, providing exposure to alternative blockchain technology.This behavior illustrates a balance between focused potential in XRP and risk mitigation through diversified positions.
Large-scale acquisitions during dips suggest that institutional participants anticipate future price stabilization and accumulation opportunities.
Conclusion
In summary, XRP’s technical analysis highlights a corrective pattern nearing exhaustion, bolstered by oversold momentum indicators and robust institutional ETF inflows of $15.82 million, positioning the asset for potential upward momentum toward $3.4–$3.5. As market participants monitor key levels like $3.18 for confirmation, staying informed on these developments can guide strategic decisions in the evolving crypto landscape—consider reviewing your portfolio for opportunities ahead.
Comments
Other Articles
XRP’s Bullish Positioning May Weather $1B Escrow Release
January 1, 2026 at 06:02 PM UTC
XRP ETF Inflows and RWA Growth Signal Potential Amid Stagnant Price
January 1, 2026 at 10:47 AM UTC
XRP ETF Inflows Hit $1.16B as Standard Chartered Eyes $8 Potential Amid Whale Selling
January 1, 2026 at 04:48 AM UTC