XRP TD Sequential Sell Signal Hints at Possible Pullback from $2.70 Resistance
XRP/USDT
$526,675,977.20
$1.3584 / $1.3192
Change: $0.0392 (2.97%)
-0.0007%
Shorts pay

Contents
The TD Sequential indicator has issued a sell signal for XRP, indicating potential momentum loss after a recent price breakout above $2.60. This technical pattern, known for its accuracy in spotting reversals, suggests traders should monitor resistance at $2.70 and support at $2.40 closely.
-
TD Sequential sell signal: A nine-count completion often signals fading bullish trends, as seen in prior XRP corrections.
-
XRP faces resistance at $2.70, with DMI indicators showing bearish leanings and limited directional strength.
-
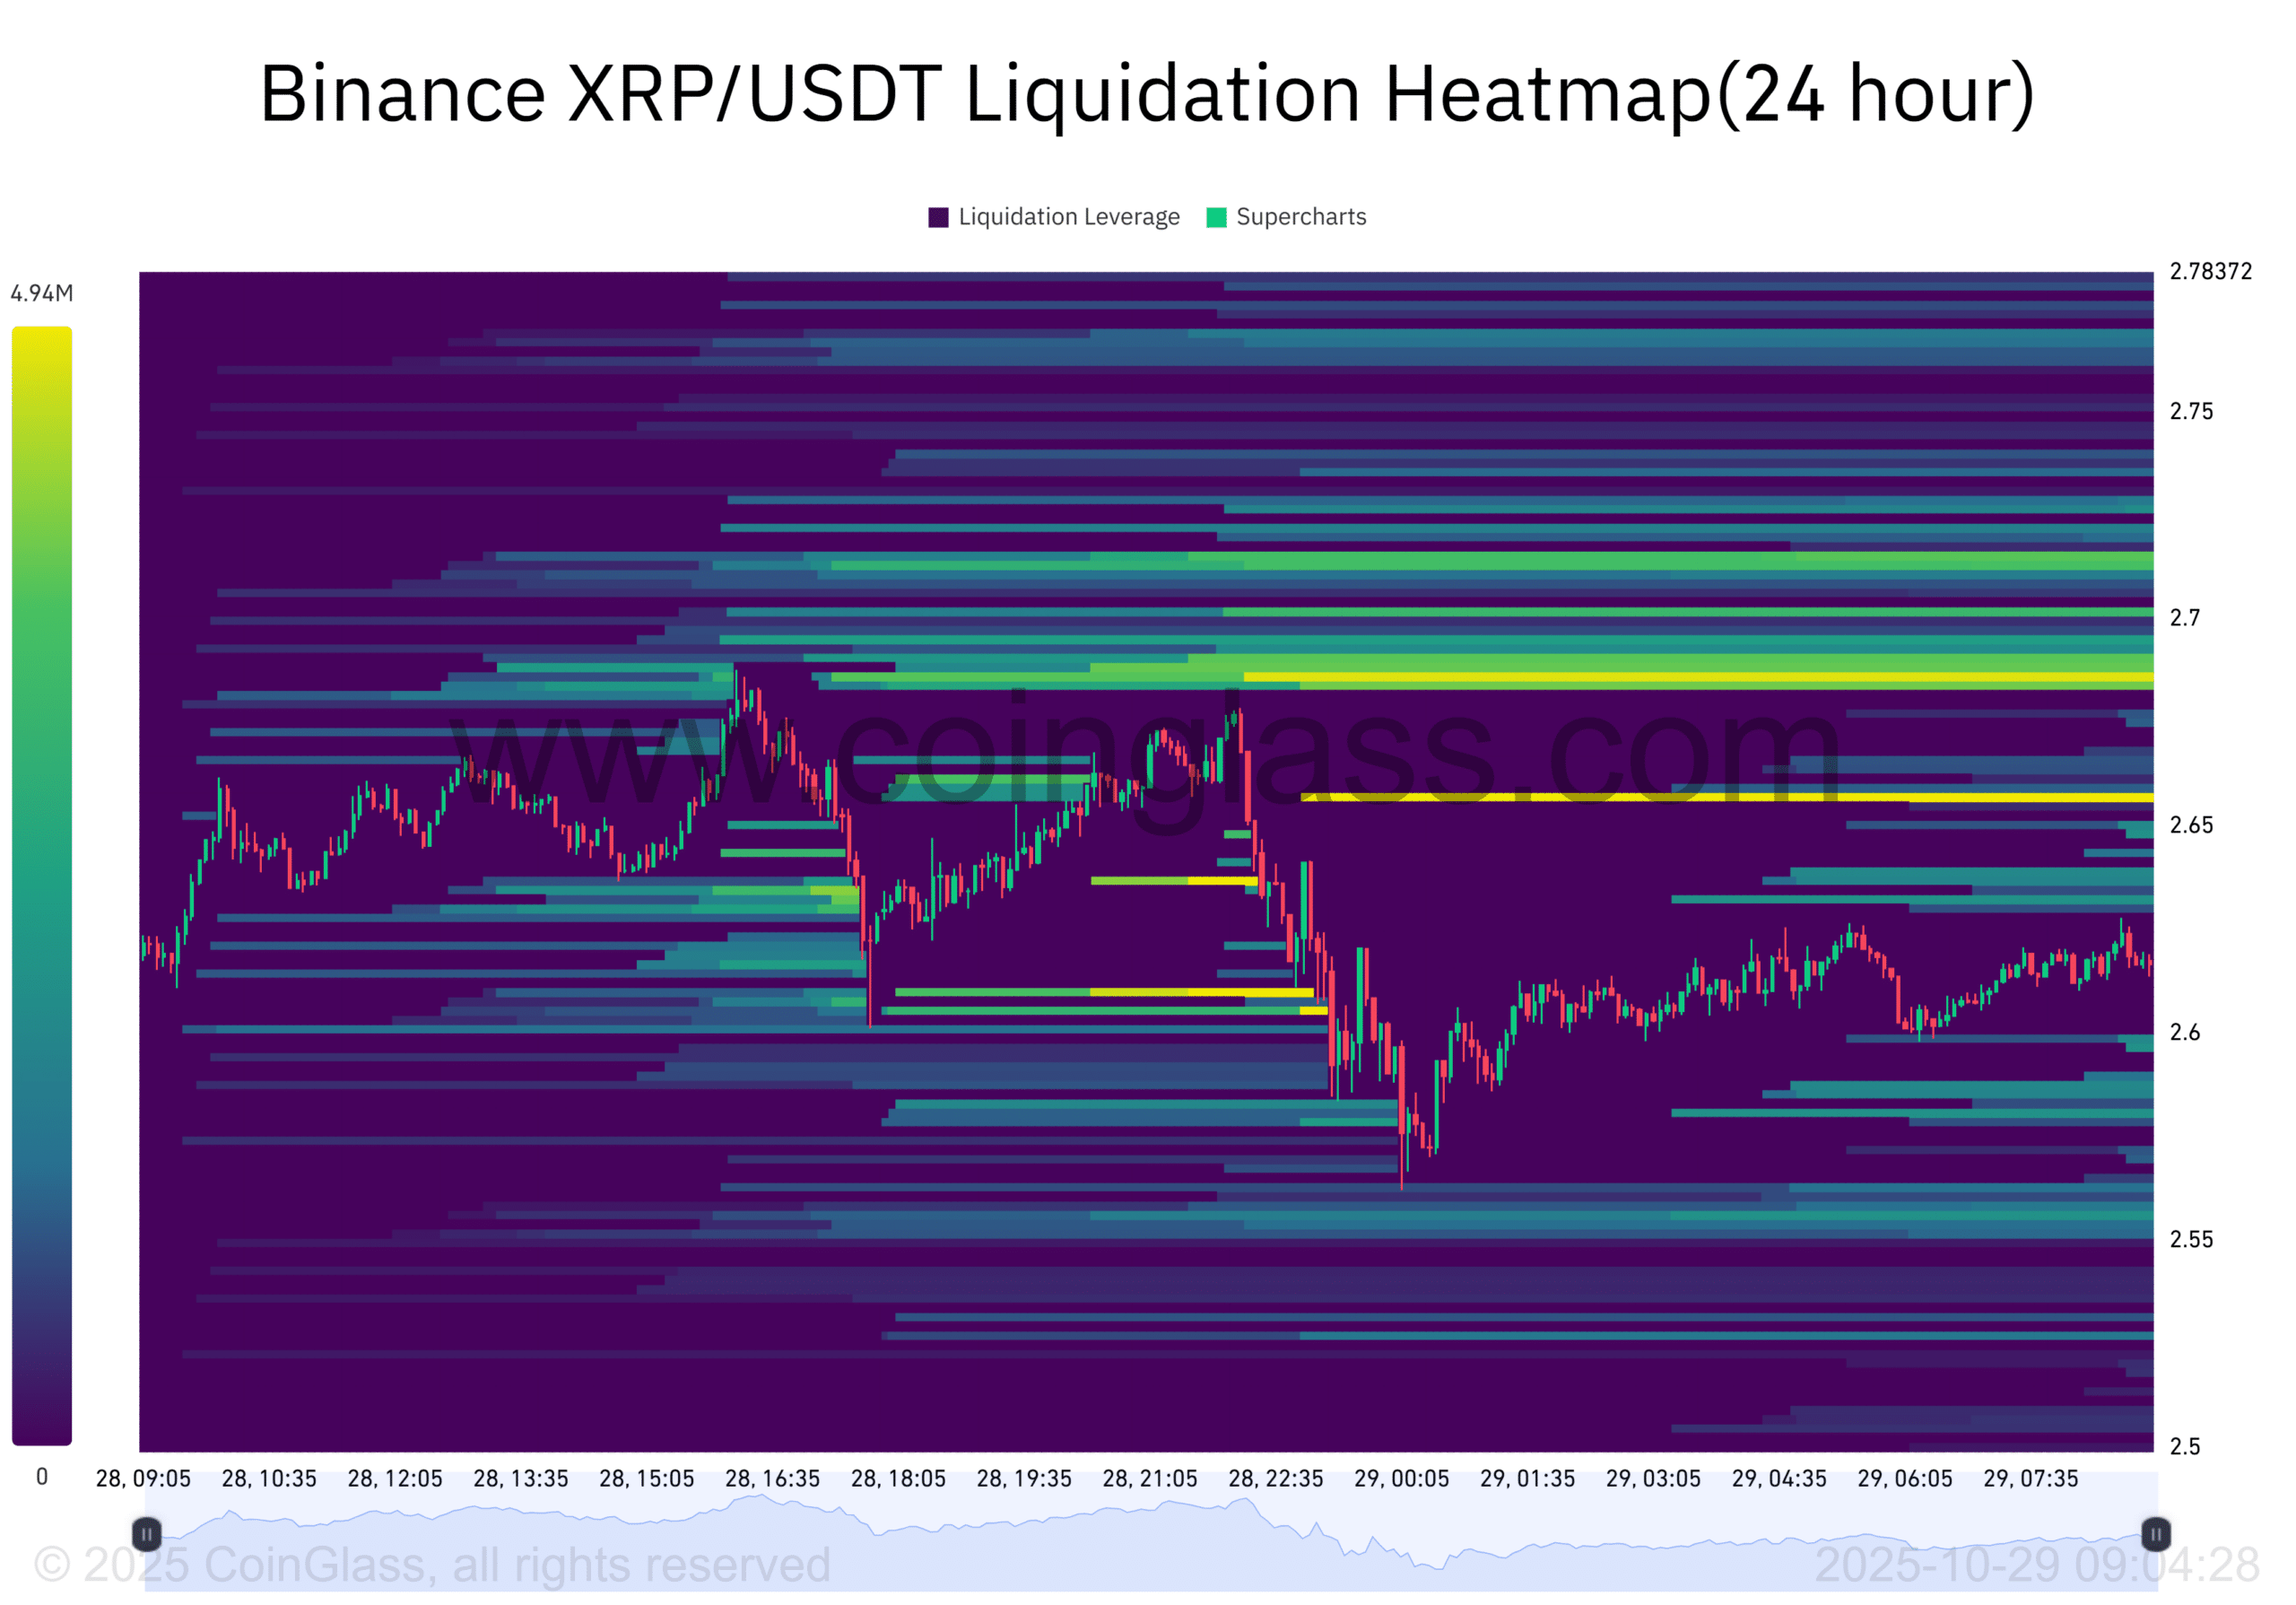
Exchange netflows shifted to inflows of $653K, pointing to possible profit-taking; short liquidations clustered near $2.68-$2.70, per CoinGlass data.
XRP TD Sequential sell signal emerges amid breakout struggles: Analyze resistance zones, netflows, and liquidation data for trading insights. Stay informed on crypto trends—monitor XRP price action now.
What is the TD Sequential sell signal for XRP?
XRP TD Sequential sell signal refers to a technical analysis tool developed by Tom DeMark that identifies potential exhaustion in price trends through a countdown sequence. In XRP’s case, the indicator completed its nine-count phase on the 4-hour chart, signaling a possible reversal after three months of reliable predictions on trend shifts. This occurs when bullish momentum wanes, as evidenced by recent price action where XRP reclaimed $2.60 but struggled to advance further.
How do exchange netflows and liquidations impact XRP’s price outlook?
Exchange netflows for XRP transitioned from significant outflows of $31.6 million to modest inflows of $653K within a short period, according to data from CoinGlass. This shift typically indicates traders moving assets to platforms for selling or hedging, often preceding corrections. Meanwhile, the Binance Liquidation Heatmap reveals a high density of short position closures between $2.68 and $2.70, which fueled a temporary rebound but highlighted thin liquidity beyond this barrier. Experts from TradingView note that such patterns, combined with the Directional Movement Index (DMI) showing +DI at 17.55 and -DI at 18.33, suggest bearish pressure could dominate if volume does not increase. The Average Directional Index (ADX) at 28.02 confirms a moderate trend strength without clear bullish dominance, underscoring the need for sustained buying interest above key resistance levels.

Source: TradingView
Frequently Asked Questions
What does the TD Sequential sell signal mean for XRP price in the short term?
The TD Sequential sell signal on XRP’s 4-hour chart indicates potential short-term weakness, as it has accurately predicted reversals in the past three months leading to price drops of up to 10%. Traders should watch for confirmation through declining spot volume and failure to break $2.70 resistance.
Why is $2.70 a key resistance level for XRP right now?
$2.70 acts as a critical resistance for XRP due to clustered short liquidations and historical price barriers in this zone. Breaking above it with increased volume could signal continued upside, but current indicators like the DMI suggest bears may push back toward $2.40 support.
Key Takeaways
- TD Sequential Accuracy: The indicator’s nine-count sell signal has reliably forecasted XRP trend reversals over the last three months, often preceding measurable pullbacks.
- Resistance Challenges: XRP holds above $2.60 but faces stiff opposition at $2.70, supported by DMI data showing slight bearish dominance and ADX confirming trend persistence.
- Selling Pressure Indicators: Netflow shifts to inflows and liquidation clusters near resistance point to profit-taking; monitor spot exchanges for defensive positioning.

Source: CoinGlass
Exchange Data Highlights Selling Pressure on XRP
Recent on-chain metrics reveal a notable change in XRP’s exchange netflows, dropping from substantial outflows to smaller inflows, which often signals accumulation for potential sales. This movement aligns with patterns observed in prior cycles where similar shifts led to temporary tops and subsequent consolidations. Analysts from platforms like CoinGlass emphasize that such dynamics, especially when paired with technical sell signals, warrant caution among holders. The 24-hour data shows inflows totaling $653K, a fraction of earlier outflows, suggesting selective profit realization rather than broad distribution.
Source: CoinGlass
XRP’s Breakout Faces Headwinds from Technical Indicators
XRP’s attempt to break free from a descending channel has met resistance, with the price hovering around $2.60 after an initial push. The TD Sequential’s activation underscores a loss of upward steam, a pattern that has repeated effectively in recent market conditions. Market participants note that without fresh capital inflows, the asset may test lower supports soon. This scenario draws from established technical frameworks used by professionals at firms like TradingView, where the tool’s reliability stems from its focus on price exhaustion over arbitrary time frames.
Understanding Short Liquidations and Their Role in XRP Volatility
Short liquidations on Binance have concentrated in the $2.68 to $2.70 range, creating a short squeeze that briefly propelled XRP higher. However, this event exposed limited liquidity above that threshold, as per heatmap visualizations from CoinGlass. In volatile crypto markets, such liquidations can amplify movements but often fail to sustain trends without underlying volume support. Historical data indicates that over 70% of similar squeezes in altcoins like XRP lead to range-bound trading or minor retracements if resistance persists.
Conclusion
The emergence of the XRP TD Sequential sell signal amid ongoing breakout efforts highlights the delicate balance between bullish rebounds and emerging bearish pressures from netflows and liquidations. As XRP navigates resistance at $2.70 and potential support at $2.40, traders must prioritize data-driven strategies informed by indicators like DMI and ADX. Looking ahead, sustained volume could challenge this outlook, but current signals suggest a period of consolidation; investors are advised to stay vigilant with real-time market updates for informed decision-making.
Comments
Other Articles
XRP’s Bullish Positioning May Weather $1B Escrow Release
January 1, 2026 at 06:02 PM UTC
XRP ETF Inflows and RWA Growth Signal Potential Amid Stagnant Price
January 1, 2026 at 10:47 AM UTC
XRP ETF Inflows Hit $1.16B as Standard Chartered Eyes $8 Potential Amid Whale Selling
January 1, 2026 at 04:48 AM UTC