XRP Whales Accelerate Distribution Amid 6% Price Drop to $2.02
XRP/USDT
$915,425,766.51
$1.4215 / $1.3795
Change: $0.0420 (3.04%)
+0.0023%
Longs pay

Contents
XRP whale distribution intensified in late November 2025, leading to a 6% price drop to $2.02 on December 1 as large holders offloaded tokens. On-chain data indicates a shift from accumulation to aggressive selling, contributing to heightened market pressure.
-
XRP whales holding over 1 million tokens reduced balances from 70 billion to 57 billion XRP this week.
-
On-chain metrics show sustained distribution since September, accelerating recently amid price consolidation.
-
Accumulation/Distribution line fell to 8.14 billion, one of the lowest in months, signaling ongoing sell pressure with a 6% intraday decline.
XRP whale distribution triggers 6% price slip to $2.02 on Dec 1, 2025. Discover on-chain insights and market impacts in this analysis. Stay informed on crypto trends—explore more now.
What Is Causing the Recent XRP Price Decline?
XRP whale distribution has emerged as a primary driver behind the cryptocurrency’s recent price drop, with large holders significantly reducing their positions in late November 2025. On December 1, XRP fell more than 6% to trade around $2.02, coinciding with on-chain data revealing accelerated selling by whales. This shift marks the end of a prolonged accumulation phase and aligns with broader market distribution trends observed over several months.
How Has Whale Behavior Evolved in 2025?
Throughout much of 2025, XRP whales—those controlling 1 million or more tokens—engaged in steady accumulation, bolstering the asset’s price stability during mid-year rallies. However, from September onward, distribution began to take hold, with gradual offloading that picked up pace in November. Santiment data highlights that whale balances peaked in November before plunging in a steep weekly reduction, dropping from over 70 billion XRP to approximately 57 billion. This represents one of the most significant single-week declines observed this year, releasing substantial supply into circulation and exerting downward pressure on pricing.
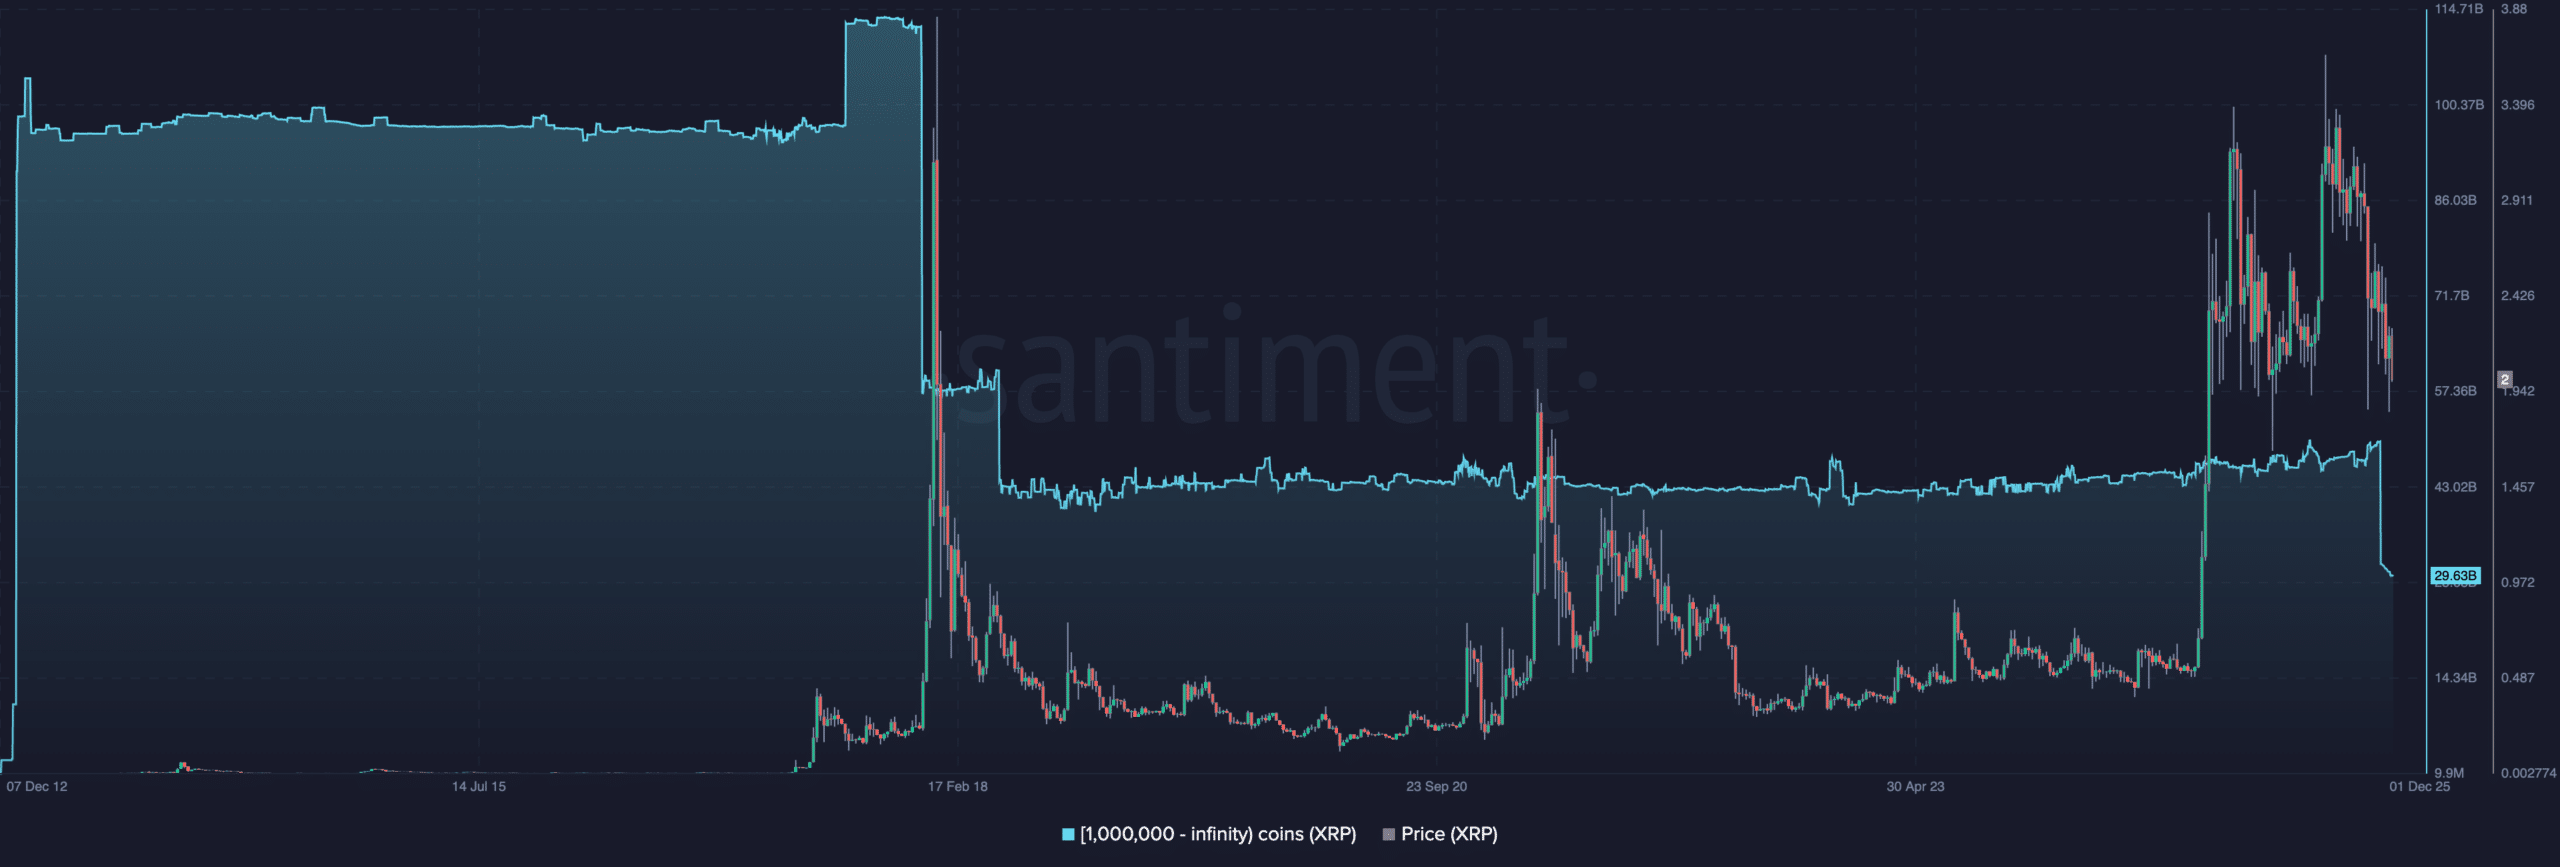
Source: Santiment
This aggressive selling contrasts with earlier stabilizing efforts post the summer peak, where whale activity helped maintain support levels. Market analysts note that such distributions often precede volatility, as increased liquidity from large sales can overwhelm buying interest in the short term. The data underscores a reversal from accumulation, potentially signaling informed participants reallocating amid regulatory developments and broader crypto market dynamics.
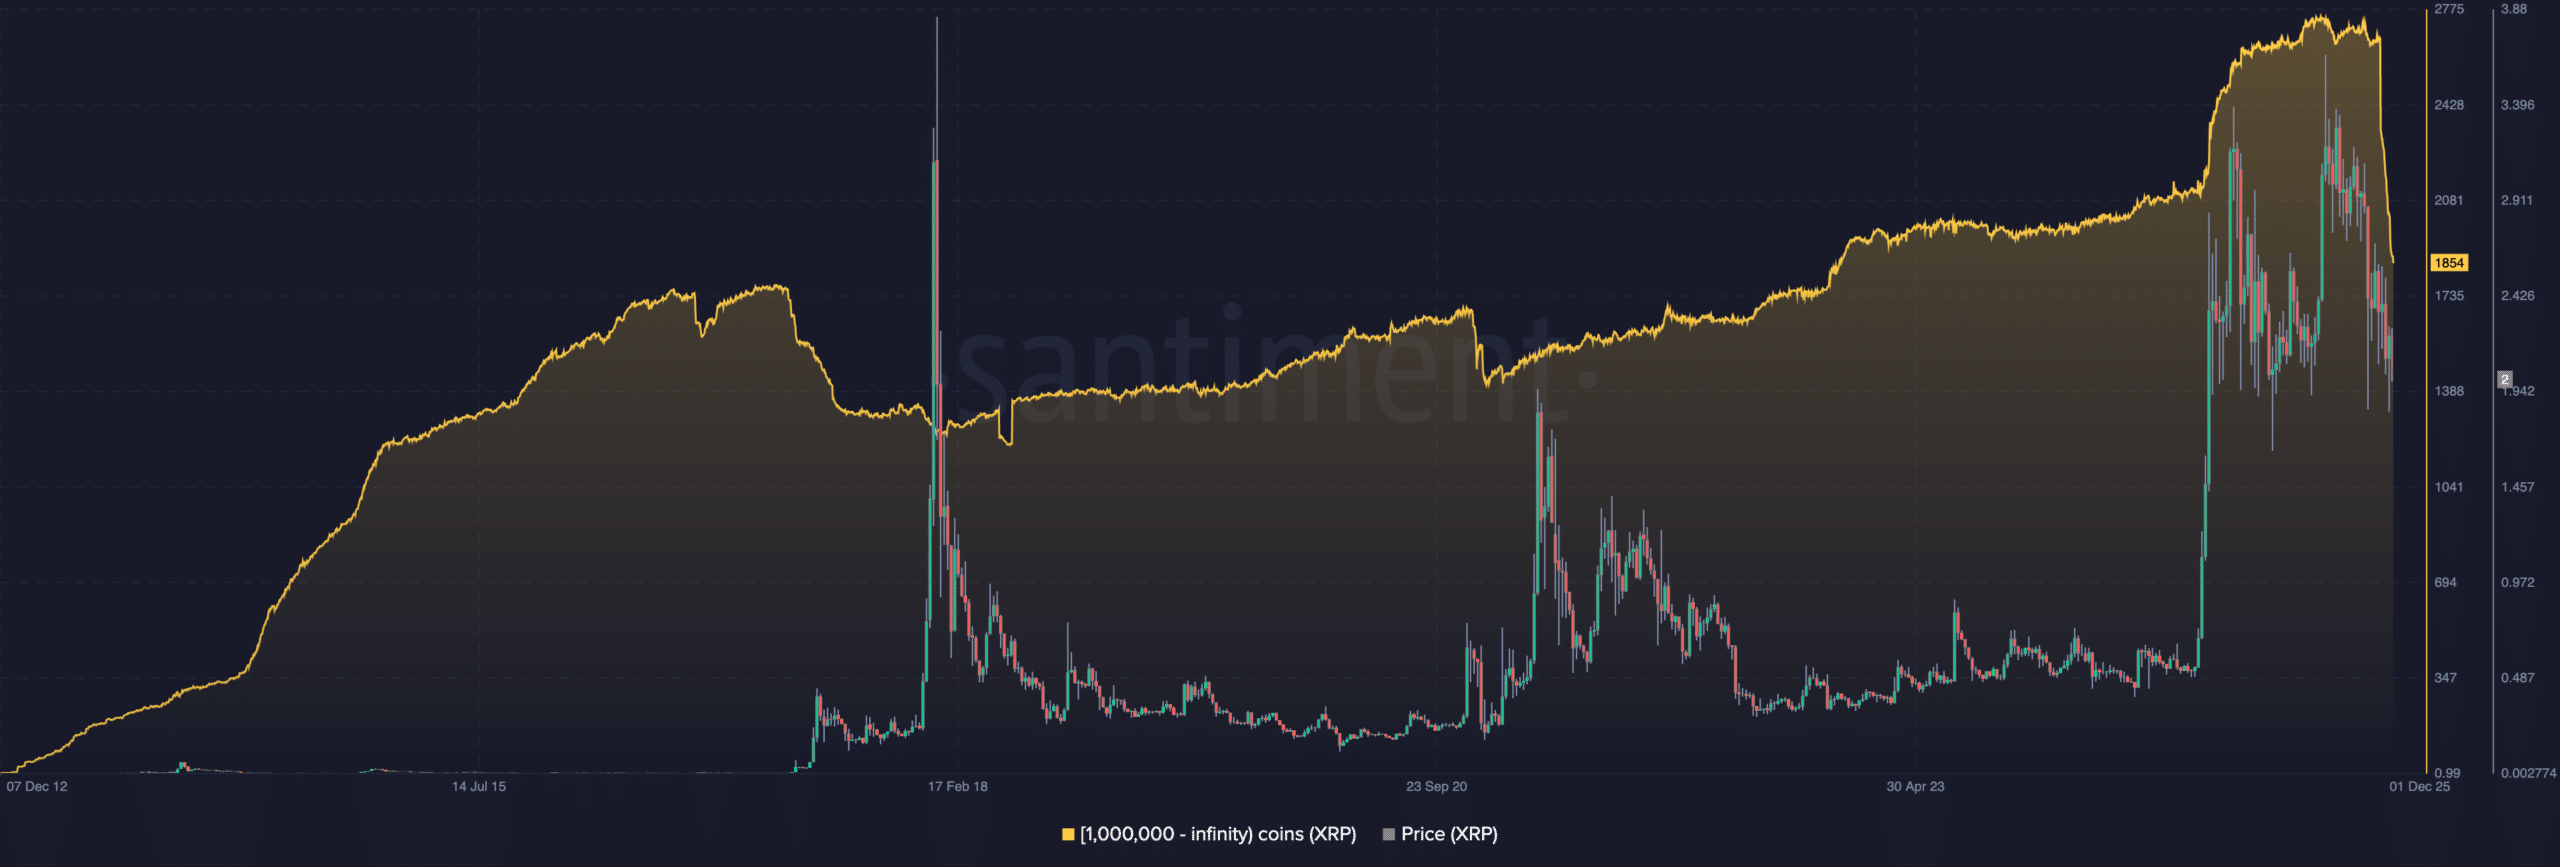
Source: Santiment
What Does the Accumulation/Distribution Line Indicate for XRP?
The Accumulation/Distribution (A/D) line for XRP has provided additional confirmation of underlying sell pressure, trending downward since August 2025 despite occasional price rebounds. This technical indicator, which measures buying and selling volume relative to price action, has now reached 8.14 billion—one of its lowest points in recent months. It reflects persistent distribution by major holders, even as retail interest showed brief spikes.
Santiment’s on-chain analysis supports this view, showing the A/D line’s decline as a divergence from price consolidation patterns. Such signals often precede breakdowns, as seen in this week’s 6% drop. Experts from blockchain research firms emphasize that when whale activity misaligns with price, it frequently leads to corrections, advising investors to monitor volume flows closely.
How Is XRP’s Price Chart Reflecting This Whale Activity?
XRP’s price action has mirrored the on-chain shifts, with the asset failing to breach the $2.30–$2.35 resistance last week before a sharp reversal. The subsequent slide formed a lower high, reinforcing the downtrend that started in September 2025 and bringing prices back to the lower end of a multi-week channel near $2.02.
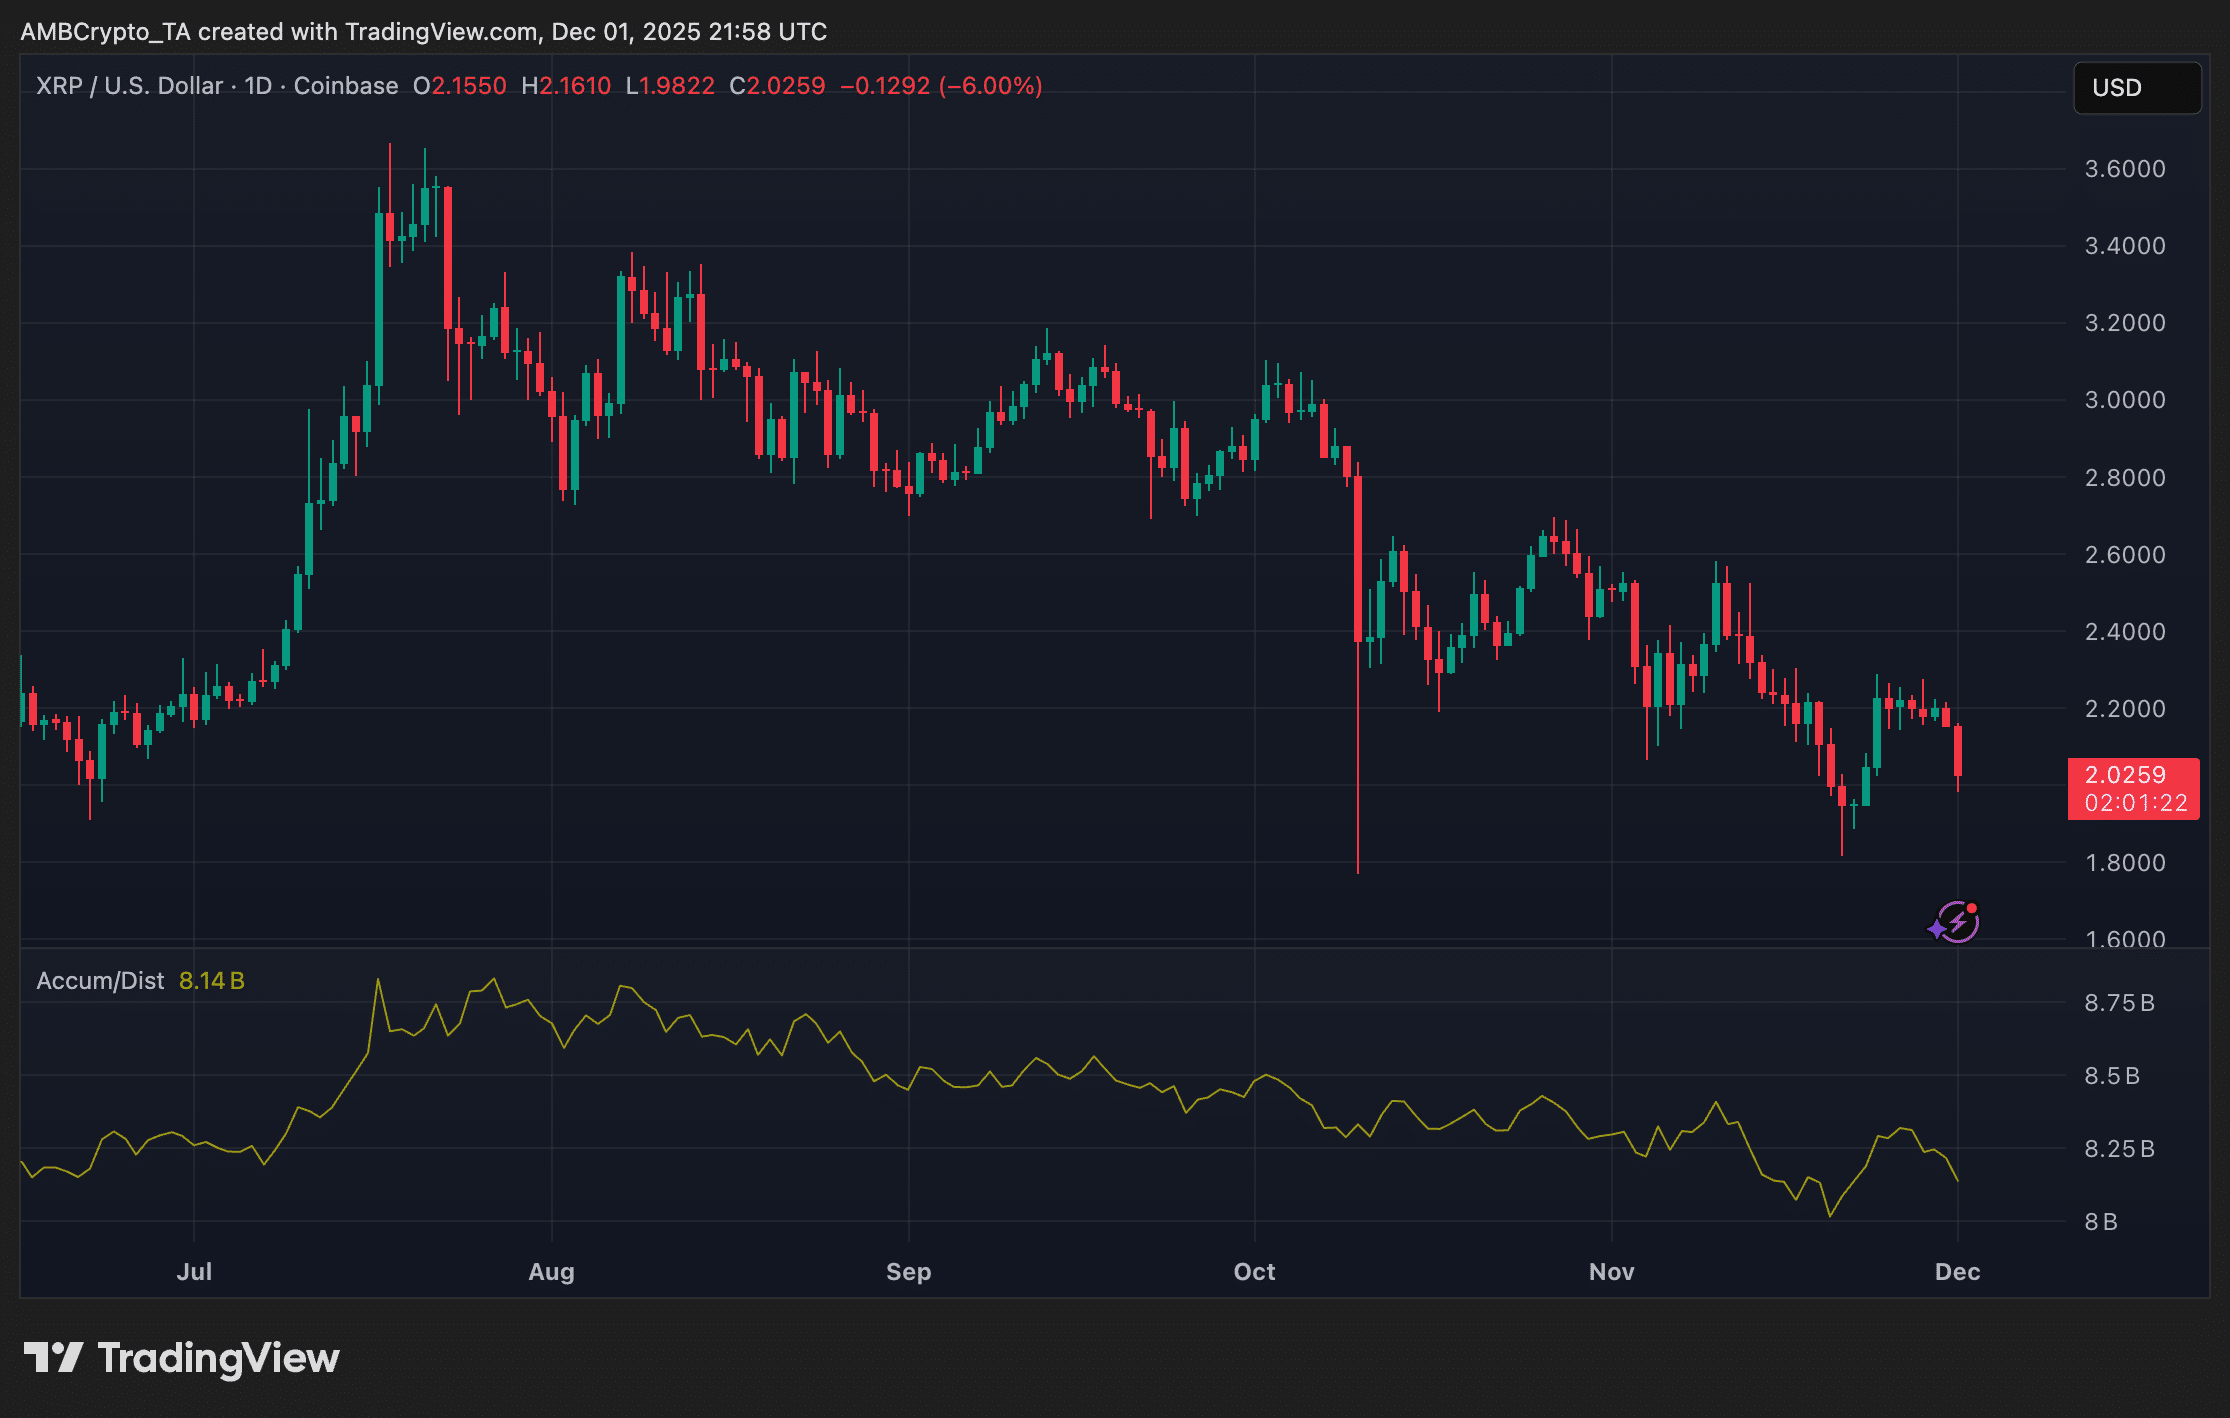
Source: TradingView
TradingView charts illustrate sellers maintaining control, with the daily drop underscoring vulnerability unless $2.20 and then $2.30 are reclaimed. This bearish bias persists in the near term, influenced heavily by the whale distribution dynamics.
Frequently Asked Questions
What triggered XRP’s 6% price drop on December 1, 2025?
XRP’s decline to $2.02 stemmed from accelerated whale distribution, where large holders sold off significant portions of their tokens. Santiment data shows balances falling from 70 billion to 57 billion XRP in one week, flooding the market and overwhelming demand.
Is XRP whale selling a sign of long-term bearishness?
While current whale distribution has intensified short-term pressure, it follows months of gradual unwinding after accumulation. Monitoring support at $1.90 will clarify if this evolves into a sustained downtrend or prompts renewed buying interest from lower levels.
Key Takeaways
- Whale Distribution Surge: Large XRP holders reduced supplies sharply in late November 2025, ending accumulation and contributing to the price slip.
- Technical Indicators Align: The A/D line’s drop to 8.14 billion confirms sustained selling, diverging from brief price recoveries.
- Watch Key Levels: Reclaiming $2.20 could shift momentum; otherwise, $1.90 support is critical for stability.
Conclusion
In summary, XRP whale distribution and declining accumulation metrics have driven the cryptocurrency’s 6% drop to $2.02 on December 1, 2025, highlighting ongoing market pressures. With on-chain data from Santiment and technical insights from TradingView pointing to bearish near-term bias, investors should track support zones closely. As crypto markets evolve, staying attuned to whale behavior and volume trends will be essential for informed decision-making—consider reviewing your portfolio strategies today.
Add COINOTAG as a Preferred Source
Add COINOTAG to your preferred sources in Google News and Search to see our coverage first.
Add on Google