ZCash Technicals Hint at Retracement After 1,800% Rally Amid Bearish Signals
BTC/USDT
$18,700,568,410.52
$74,514.10 / $72,512.49
Change: $2,001.61 (2.76%)
+0.0041%
Longs pay

Contents
ZCash price surged an impressive 1,838.5% from $38.69 in September to $750 in November 2025, fueled by growing interest in privacy-focused cryptocurrencies. A subsequent 53% retracement has occurred amid broader market pressures, but technical indicators suggest this may be a temporary pullback rather than the end of the uptrend.
-
ZCash rally highlights: 18-fold gains in under 10 weeks driven by privacy coin momentum.
-
Recent 53% decline follows profit-taking at key Fibonacci levels, signaling a potential retracement phase.
-
Technical analysis shows bearish short-term momentum, with MFI below 20 and OBV sliding, but long-term supports at $315-$321 and $197 remain critical.
Explore ZCash price analysis: From 1,838% rally to 53% drop in 2025. Discover key supports, technical insights, and what’s next for ZEC investors. Stay ahead in crypto markets today.
What is the ZCash Price Trend in 2025?
ZCash price has shown remarkable volatility in 2025, marking it as a standout performer among major cryptocurrencies. Starting from a low of $38.69 in September, ZEC achieved a staggering high of $750 by early November, representing an 1,838.5% increase over less than 10 weeks. This surge was propelled by heightened demand for privacy-oriented assets, though a sharp 53% pullback in the following weeks has introduced short-term bearish pressures, potentially tied to market-wide sentiment shifts and Bitcoin’s performance.
How Do Fibonacci Retracement Levels Influence the ZCash Rally?
Fibonacci retracement levels provide crucial insights into the ZCash price trajectory, helping traders identify potential support zones during pullbacks. In the recent rally, profit-taking aligned with the 100% Fibonacci extension from prior cycle swing points, as noted in an COINOTAG analysis from November. The current 53% drop has respected the 78.6% retracement level, which has not yet been breached, indicating that the overall bullish structure may persist. For instance, key supports at $315-$321 and deeper at $197 align with these levels, offering potential buying opportunities if broader market conditions stabilize. Short sentences underscore the importance: Bears control momentum now, but historical data shows privacy coins like ZEC often rebound from such retracements with renewed vigor.
ZCash has emerged as an exceptional case in the cryptocurrency landscape, particularly among larger market cap assets. The privacy narrative gained significant traction starting in September 2025, initiating a sharp upward movement that accelerated through October. This period saw ZCash deliver returns far exceeding typical market performance, drawing attention from investors focused on secure, anonymous transactions.
From the September trough at $38.69 to the November peak of $750, the asset recorded a 1,838.5% gain—an extraordinary 18 times the initial value in just under 10 weeks. Such rapid appreciation is rare, even in the volatile crypto sector, and highlighted ZCash’s unique position amid rising concerns over transaction privacy in digital finance.
The early November high coincided with a broader market downturn, including Bitcoin’s retreat from the $100,000 mark. This confluence of factors raised questions about whether ZCash’s momentum had fully dissipated. Technically, however, evidence points toward a corrective phase rather than a complete reversal, allowing for a more measured assessment of future movements.
Long-term Structure vs. Short-term Bearishness
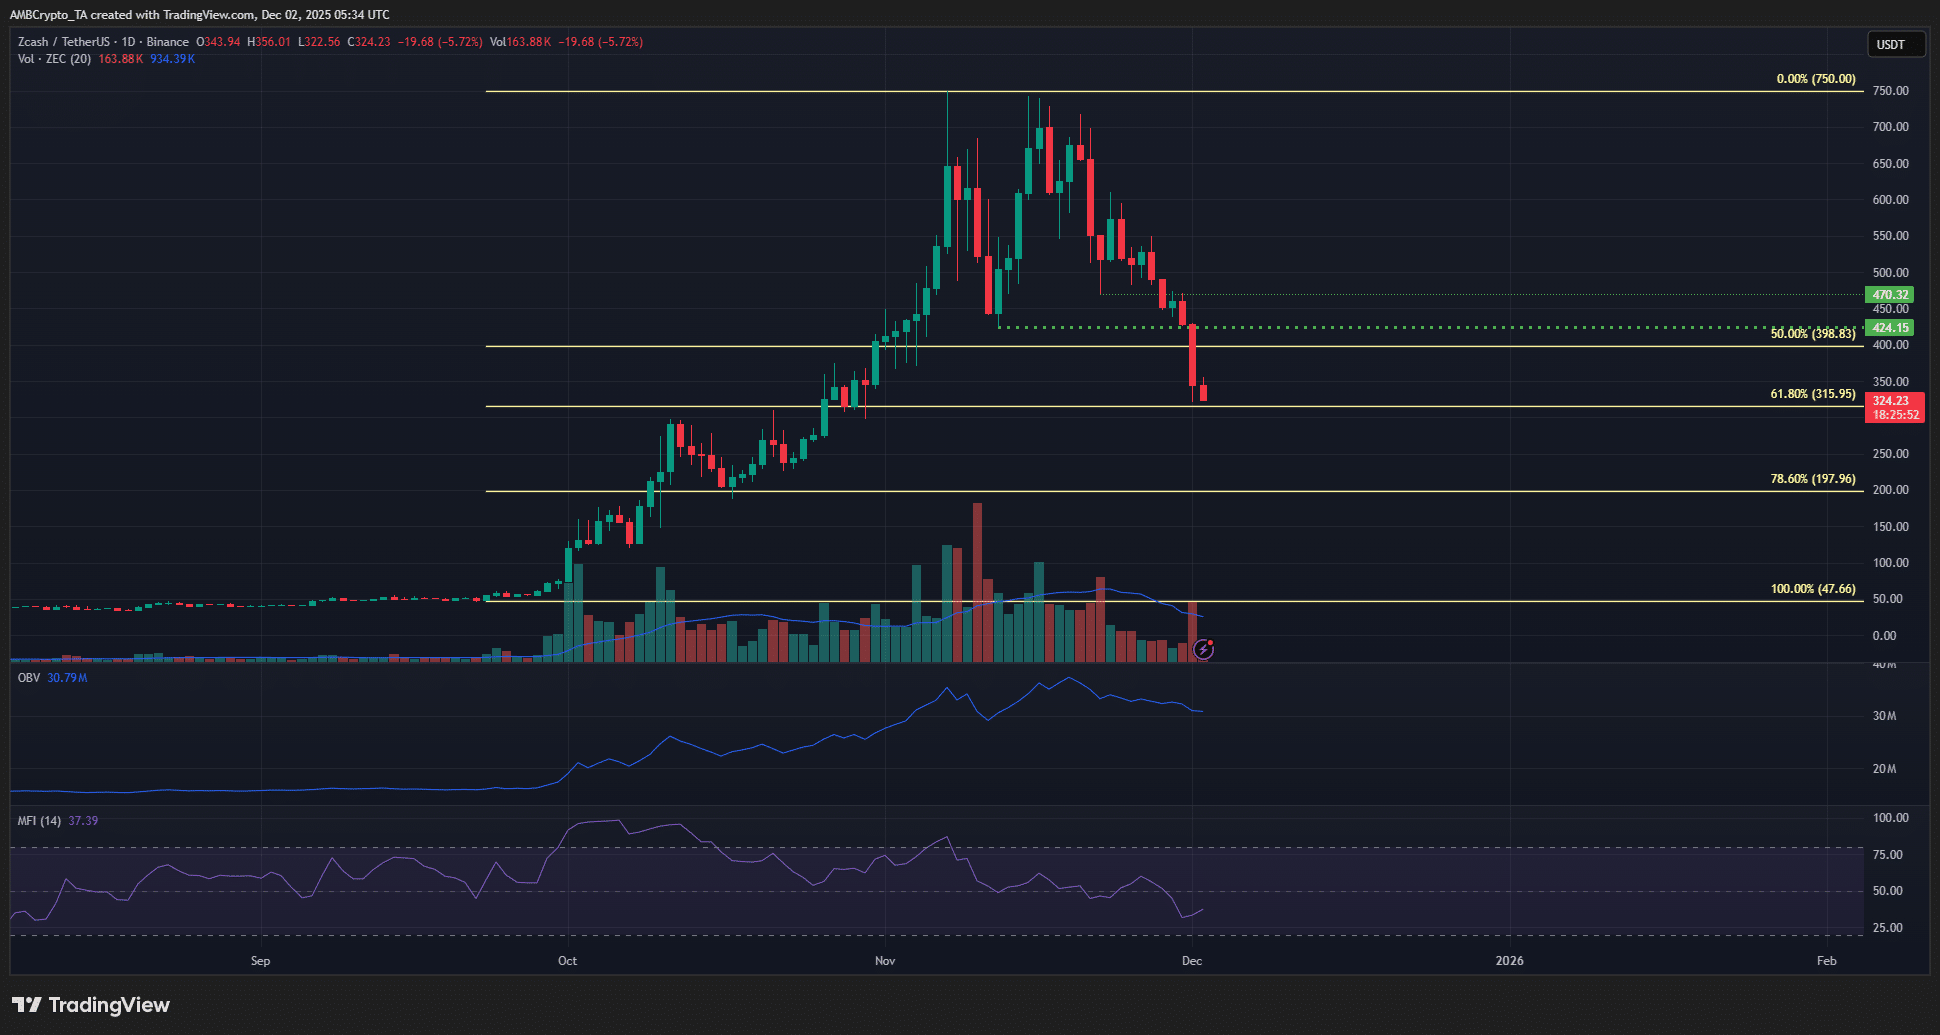
Source: ZEC/USDT on TradingView
On the 1-day chart, ZCash exhibited a shift toward bearish internals. The higher low established at $470 was broken approximately ten days ago, marking the start of intensified selling pressure. The subsequent breach below the $424 swing low confirmed the retracement’s depth and raised flags for a possible downtrend if supports fail.
Despite this, Fibonacci retracements from the rally’s swing points offer a counterbalance. The 78.6% level continues to hold firm, suggesting the uptrend’s foundational structure remains viable. This dynamic illustrates the tension between immediate bearish signals and longer-term optimistic frameworks in ZCash price analysis.
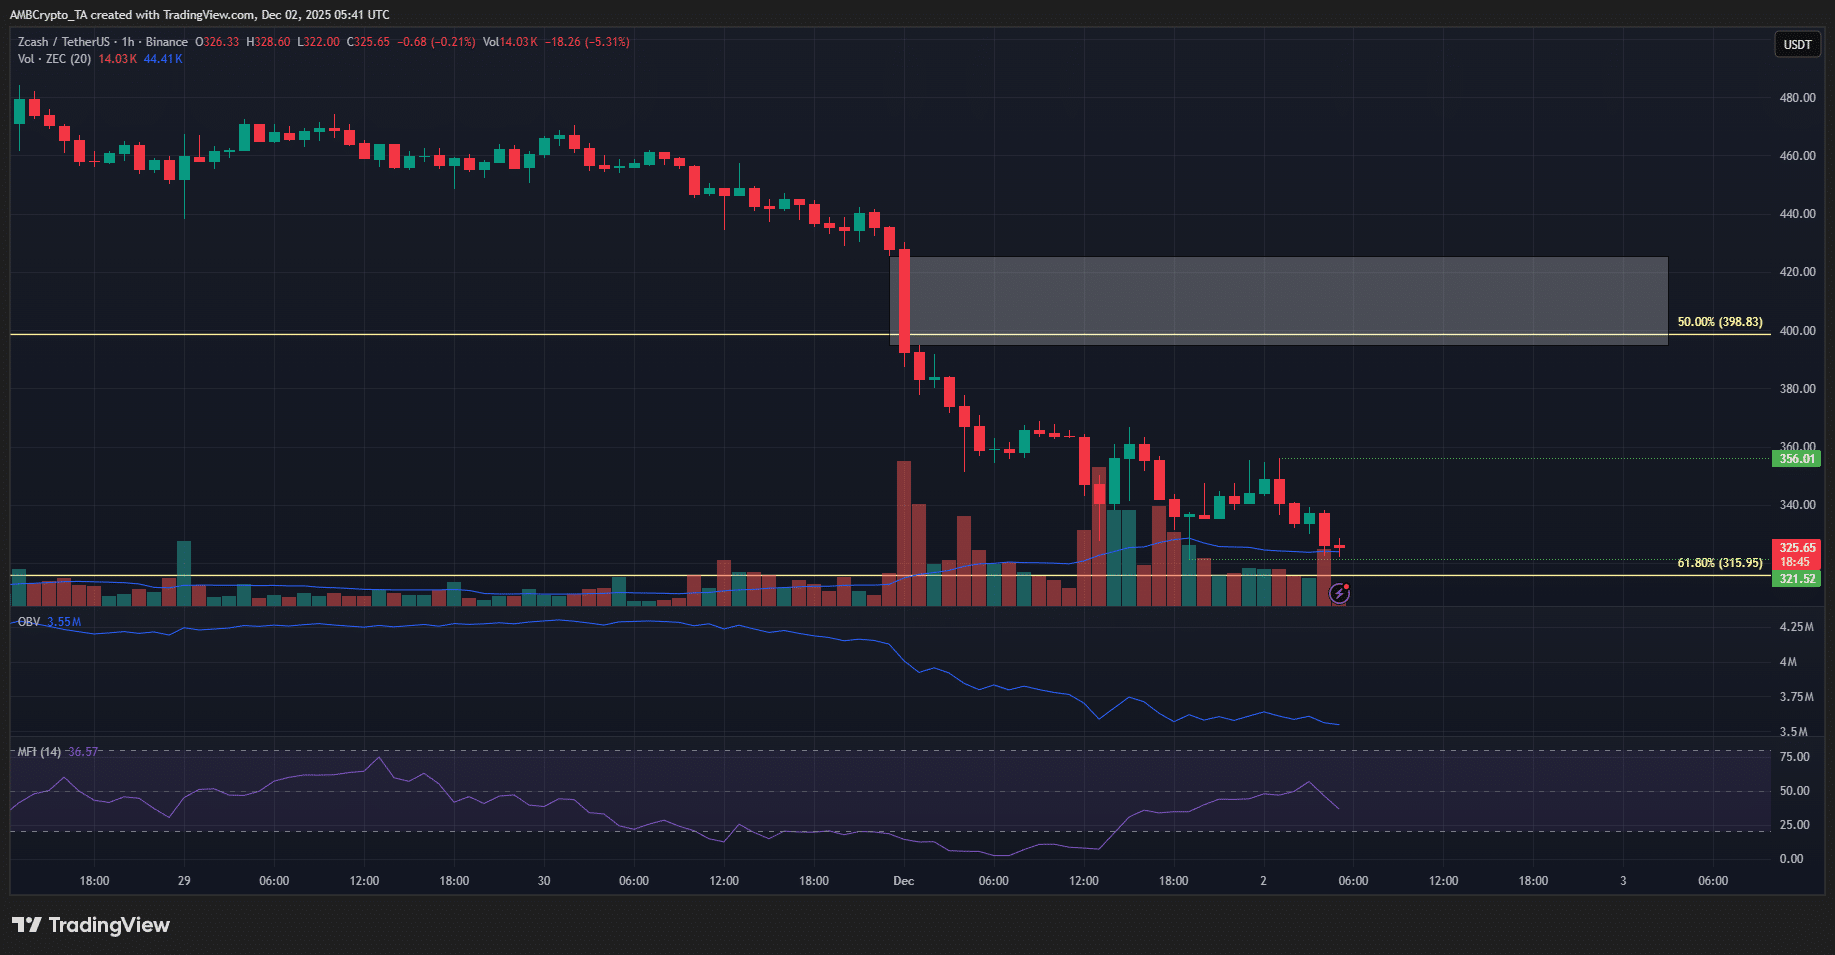
Source: ZEC/USDT on TradingView
The 1-hour timeframe reinforces short-term caution, displaying no clear setup for a substantial rebound. Bearish structure dominates here as well, with the $400-$420 zone emerging as a supply area due to unresolved imbalances. Traders monitoring intraday action should watch for rejection patterns in this range to gauge further downside risk.
ZCash: Piecing Together the Technical Indicators
Across both daily and hourly charts, the Money Flow Index (MFI) indicates seller dominance in ZCash price dynamics. On the daily view, MFI recently dipped below 20, confirming a bearish shift in momentum and capital flows over the past few days. This level often signals oversold conditions, though persistent selling could extend the decline.
The hourly MFI aligns with this outlook, pointing to heightened probability of additional near-term losses. Meanwhile, the On-Balance Volume (OBV) remains relatively stable on the daily chart, avoiding a steep plunge that might confirm outright capitulation. However, the hourly OBV’s downward slide bolsters the retracement narrative, as volume fails to support price recovery efforts.
These indicators collectively paint a picture of controlled bearishness, where short-term pressures test the rally’s durability without immediately erasing its gains. Historical patterns in privacy coins suggest that such phases can precede renewed accumulation if external factors, like regulatory clarity on privacy tech, turn favorable.
Key Support and Resistance Levels
In the immediate term, the $400-$420 range stands as a formidable resistance, likely to cap any upside attempts during this correction. Lower down, the $315-$321 support zone is currently under defense, but a daily close below this threshold would signal stronger selling and prompt aggressive position adjustments.
Should that occur, attention shifts to the next Fibonacci-derived support at $197, which could serve as a major floor based on prior cycle lows. Resistance above includes the recent swing low at $424, with a break above potentially invalidating the bearish setup and reigniting bullish interest.
Frequently Asked Questions
What Caused the ZCash Rally in Late 2025?
The ZCash rally in late 2025 stemmed from surging demand for privacy-enhanced cryptocurrencies amid increasing regulatory scrutiny on transaction transparency. Starting in September, ZEC climbed from $38.69 to $750 by November, a 1,838.5% gain, as investors sought assets offering zk-SNARKs-based anonymity. This momentum was amplified by market narratives favoring secure digital assets over traceable ones.
Is ZCash Price Likely to Recover from Its Recent Drop?
Yes, ZCash price shows potential for recovery if key Fibonacci supports hold, particularly the 78.6% retracement level. Short-term bearish indicators like MFI below 20 suggest more downside to $315 or $197, but the long-term structure remains intact. Monitoring Bitcoin’s trend is essential, as it often influences altcoin recoveries in voice search queries like this.
Key Takeaways
- Exceptional Rally Performance: ZCash delivered 1,838.5% gains in under 10 weeks, underscoring privacy coins’ resilience in 2025.
- Retracement Dynamics: A 53% drop aligns with Fibonacci levels, with $315-$321 as critical support to watch.
- Trading Caution: Maintain vigilance on MFI and OBV; a close below $315 may signal deeper corrections, advising measured positions.
Conclusion
In summary, ZCash price analysis reveals a cryptocurrency that has navigated extreme highs and subsequent corrections in 2025, with the privacy narrative driving its 1,838.5% surge while Fibonacci retracements guide the ongoing pullback. Technical indicators like MFI and OBV highlight short-term bearish control, yet unbreached supports suggest long-term potential. As the market evolves, investors should prioritize risk management and stay attuned to broader trends for informed decisions in the dynamic world of privacy-focused assets.
Disclaimer: The information presented does not constitute financial, investment, trading, or other types of advice and is solely for informational purposes.
Add COINOTAG as a Preferred Source
Add COINOTAG to your preferred sources in Google News and Search to see our coverage first.
Add on Google