Analyst Suggests Bitcoin Bear Market Bottom May Hold Above $55,000
BTC/USDT
$34,057,419,982.02
$76,000.00 / $72,419.28
Change: $3,580.72 (4.94%)
+0.0041%
Longs pay

Contents
Bitcoin’s bear market bottom is unlikely to drop below $55,000, according to technical analysis using Bollinger Bands and RSI indicators. This prediction counters fears of a deeper fall to $35,000, emphasizing the cryptocurrency’s current cycle dynamics and historical patterns that suggest shallower corrections amid growing institutional adoption.
-
Bitcoin has never breached the monthly lower Bollinger Band during past cycles, providing strong support around $55,000.
-
RSI levels indicate limited expansion in this cycle, making extreme 75% retraces improbable compared to previous bear markets.
-
Current price action shows a 31% decline from the $126,000 peak, typical for bull market adjustments, with support holding above $84,000 as of recent trading.
Discover why Bitcoin’s bear market bottom may hold at $55,000 based on Bollinger Bands and RSI analysis. Expert insights reveal shallower corrections ahead—stay informed on BTC price predictions for 2025.
What Is the Expected Bitcoin Bear Market Bottom in the Current Cycle?
Bitcoin bear market bottom predictions point to a minimum level around $55,000, far from the more pessimistic forecasts of $35,000. Crypto analyst Sykodelic, drawing on Bollinger Bands and Relative Strength Index (RSI) data, argues that historical patterns and current technical indicators support this floor. This outlook reflects Bitcoin’s maturing market structure, where institutional involvement dampens the severity of downturns compared to earlier cycles.
How Do Bollinger Bands Influence Bitcoin Price Predictions?
Bollinger Bands serve as a volatility-based technical tool, consisting of a middle band (simple moving average) and upper and lower bands that expand or contract with market fluctuations. In Bitcoin’s case, prices on the monthly timeframe have consistently respected the lower Bollinger Band as a key support level, never closing below it during major cycles like 2017.
Analyst Sykodelic highlighted this resilience in a recent analysis shared with followers on X, noting that even after significant gains in 2017, the retracement did not breach this band. For the current cycle, with Bitcoin trading around the monthly mid-Bollinger Band following a pullback from $126,000, a close below the midline could signal a bottom near $55,000 in a worst-case scenario. This is supported by data from TradingView, where Bollinger Bands on BTC/USD monthly charts show the lower band aligning closely with $55,000 levels.
Experts emphasize that such indicators provide probabilistic insights rather than certainties. As Augustine Fan, head of insights at SignalPlus, observed in discussions on market dynamics, breaking key supports can trigger cascading effects, but Bollinger Bands often act as a statistical boundary for price action.
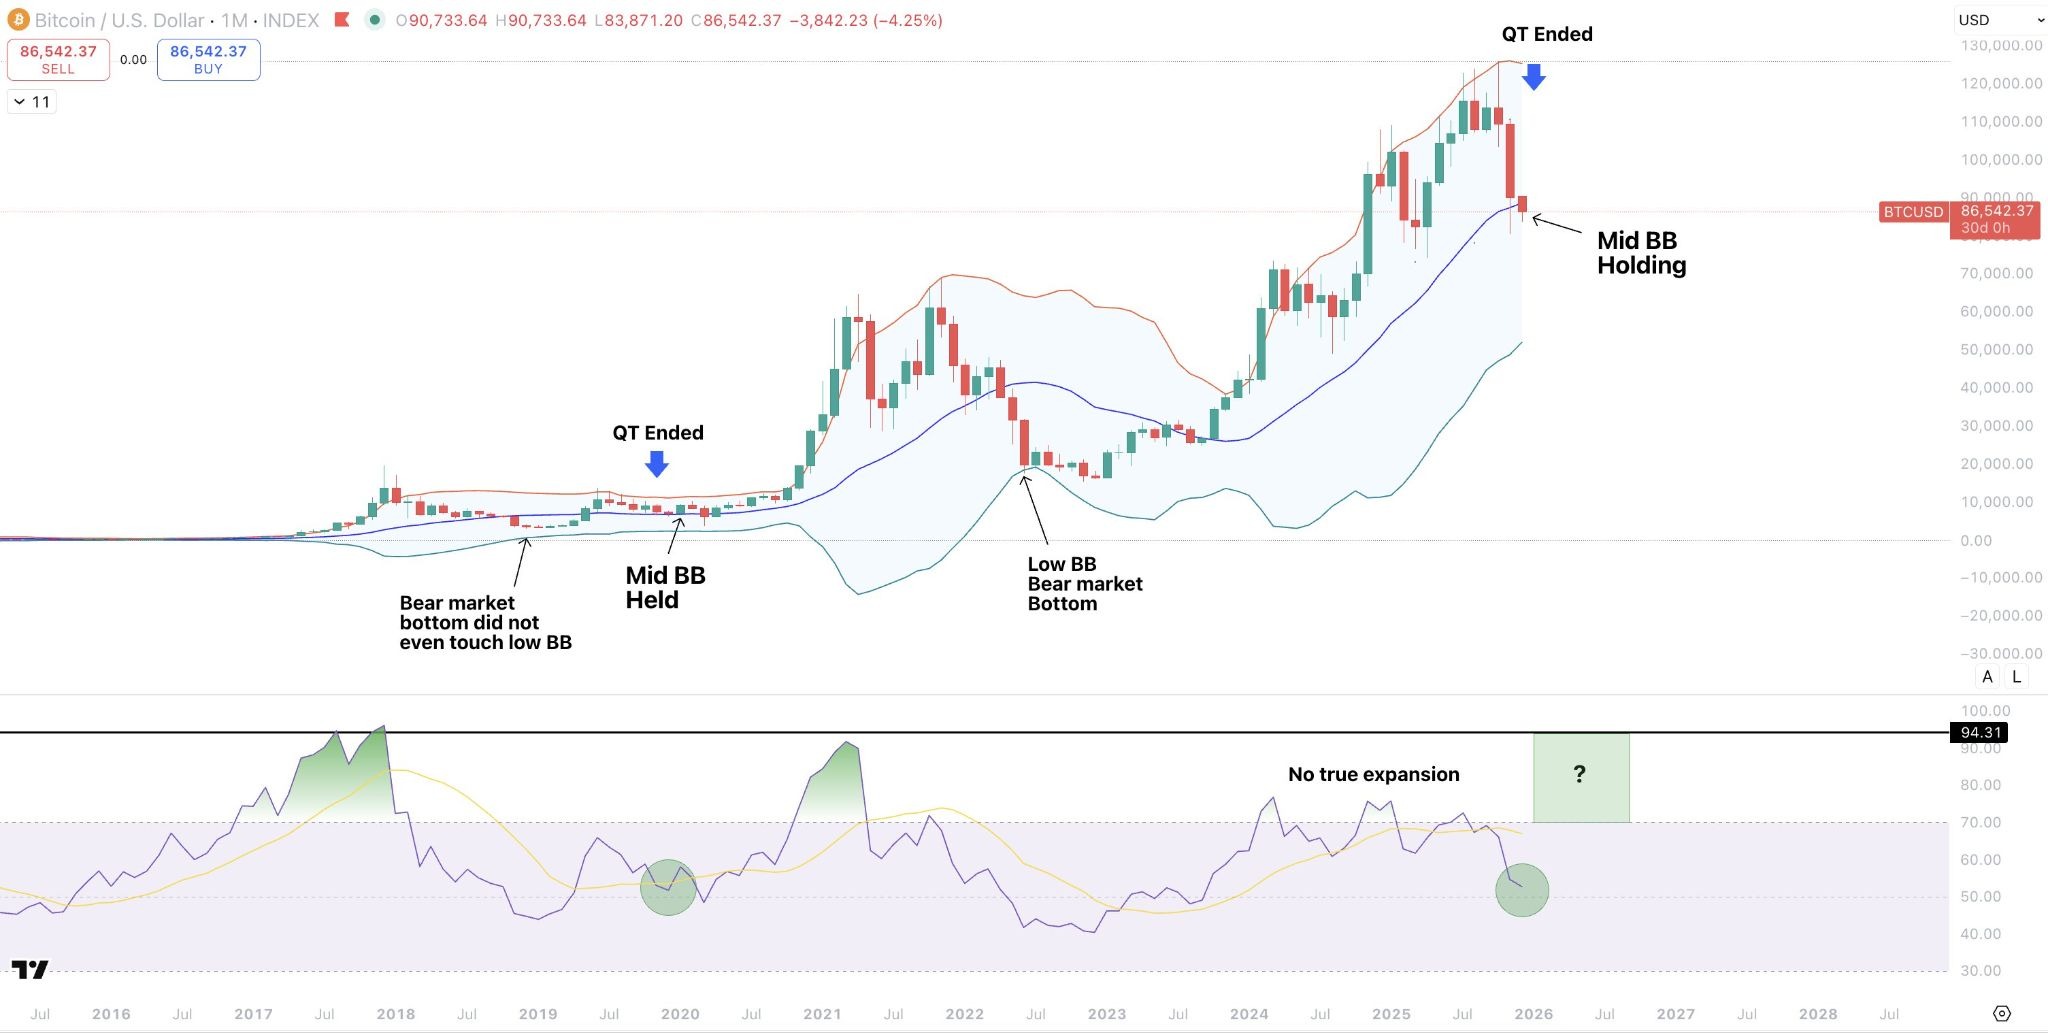
BTC is currently holding the monthly mid-Bollinger Band. Source: Sykodelic
Why Might Bitcoin Avoid a Deep Correction to $35,000?
The notion of Bitcoin plunging to $35,000 would require a 72% retracement from its recent highs, echoing the 77% drop from $69,000 in November 2021 to $15,500 in November 2022. However, Sykodelic dismissed such predictions as unfounded, explaining that extreme contractions follow periods of maximal expansion, measurable via RSI.
In this cycle, RSI readings on monthly charts peaked at levels indicating moderate expansion, insufficient for a repeat of past deep bears. For instance, the 2021-2022 cycle saw RSI surge above 90, enabling the sharp reversal, whereas current metrics hover in the 60-70 range, suggesting a more balanced correction.
This perspective aligns with broader market evolution. Bitcoin’s integration into traditional finance, including spot ETFs approved in early 2024, has increased liquidity and reduced volatility extremes. Data from CoinMarketCap shows average daily trading volume exceeding $50 billion in late 2025, compared to under $20 billion during the 2022 lows, underscoring a more resilient ecosystem.
Jeff Ko, chief analyst at CoinEx exchange, reinforced this view, stating that the traditional four-year halving cycle is evolving. With heightened institutional participation—evidenced by over $30 billion in ETF inflows year-to-date—corrections are expected to be shallower, potentially limited to $65,000-$68,000 even in a bearish case. Ko’s analysis, based on on-chain metrics from Glassnode, highlights reduced leverage in derivatives markets, minimizing liquidation cascades.
What Risks Could Lead to a Catastrophic Bitcoin Decline?
Despite optimistic technical signals, vulnerabilities persist. Augustine Fan warned that a breakdown below the $72,000-$75,000 support zone could unleash significant selling pressure. This area coincides with accumulated stop-loss orders and leveraged positions, potentially amplifying downside momentum through automated trading algorithms.
Fan, drawing from SignalPlus’s proprietary data on order flow, noted the implications for major strategies holding large BTC exposures. Implied losses could exceed $10 billion if supports fail, though current prices around $87,000 provide a buffer after dipping to $84,000 earlier this week.
Historical precedents, such as the March 2020 flash crash, illustrate how thin liquidity zones can exacerbate moves. However, post-2022 regulatory advancements, including clearer guidelines from the SEC, have bolstered market stability. On-chain analytics from firms like Chainalysis reveal that long-term holder behavior remains intact, with over 70% of supply unmoved in the past year, acting as a natural floor.
Frequently Asked Questions
What Is the Bitcoin Bear Market Bottom According to Technical Analysts?
The Bitcoin bear market bottom is projected at $55,000 based on Bollinger Bands and RSI analysis by experts like Sykodelic. This level represents the maximum pain in the current cycle, avoiding deeper retraces due to limited RSI expansion and historical price respect for key bands.
How Will Institutional Adoption Affect Bitcoin’s Next Correction?
Institutional adoption, through ETFs and broader investor participation, is set to make Bitcoin’s next correction shallower than past cycles. Analysts like Jeff Ko from CoinEx predict drawdowns capped at 30-40% from highs, thanks to increased market depth and orderly trading dynamics that prevent 70-80% crashes.
Key Takeaways
- Bollinger Bands as Support: Bitcoin’s monthly lower band has held as a floor in every cycle, currently pointing to $55,000 as a critical level amid ongoing volatility.
- RSI Limits Extreme Moves: Moderate RSI peaks in this cycle suggest corrections won’t exceed 50%, contrasting with the 2021-2022 bear’s 77% drop driven by overextended gains.
- Institutional Resilience: ETF inflows and on-chain stability encourage investors to view dips as buying opportunities, with potential for quicker recoveries in 2025.
Conclusion
The analysis of Bitcoin’s bear market bottom underscores a resilient trajectory, with technical tools like Bollinger Bands and RSI indicating support above $55,000 despite near-term pressures. As institutional forces reshape the landscape, secondary indicators such as ETF participation point to moderated volatility and sustainable growth. Investors should monitor key supports like $72,000-$75,000 closely, preparing for opportunities in this evolving crypto market—consider diversifying holdings for long-term positioning in Bitcoin’s upward trend.
Comments
Other Articles
Oil Prices Surge 3% After Trump Cancels Iran Meetings and Promises Protesters ‘Help Is on the Way’ – What It Means for Bitcoin
January 13, 2026 at 05:49 PM UTC
Bitcoin Surges to $93,888: How Venezuela-US Tensions Triggered a Crypto Rally
January 5, 2026 at 07:04 AM UTC
Bitcoin (BTC) Eyes Short-Term Bottom Rebound as On-Chain Flows Align with USDC/USDT Premium and Market Liquidity, but Bearish Longer-Term Outlook Persists
January 1, 2026 at 03:41 PM UTC