Bitcoin Approaches 2016-Style Trendline Pattern Near $82K-$84K Support
BTC/USDT
$15,421,869,619.32
$81,615.21 / $79,843.59
Change: $1,771.62 (2.22%)
+0.0010%
Longs pay

Contents
Bitcoin is trading near its long-term trendline support at around $86,704, mirroring the 2016-2017 accumulation pattern that preceded a major bullish surge. Key support levels at $84,000–$82,000 remain critical, with potential for rebound if momentum builds, as analysts observe intact multi-year structure despite recent outflows.
-
Bitcoin tracks its long-term ascending trendline, similar to the 2016–2017 base formation that led to significant price expansion.
-
Essential support zone at $84,000–$82,000; breaking above $92,100 could signal short-term bullish shift.
-
Recent net outflows totaled $358.26 million on December 1, per Coinglass data, yet the overall price structure holds firm near the trendline.
Explore Bitcoin’s long-term trendline pattern and key support levels in 2025. Analysts spot 2016 similarities signaling potential rebound. Stay informed on BTC price action and market momentum—read now for essential insights.
What is Bitcoin’s Position Relative to Its Long-Term Trendline?
Bitcoin’s long-term trendline serves as a foundational support level in its multi-year price chart, currently holding as the cryptocurrency trades at $86,704. This ascending line, drawn from major lows since 2013, has guided Bitcoin through accumulation phases, with the latest monthly candle breakdown testing it without breaching. Market data indicates sustained proximity to this trendline, fostering expectations of a rebound based on historical patterns.
How Does the Current Bitcoin Pattern Mirror the 2016-2017 Cycle?
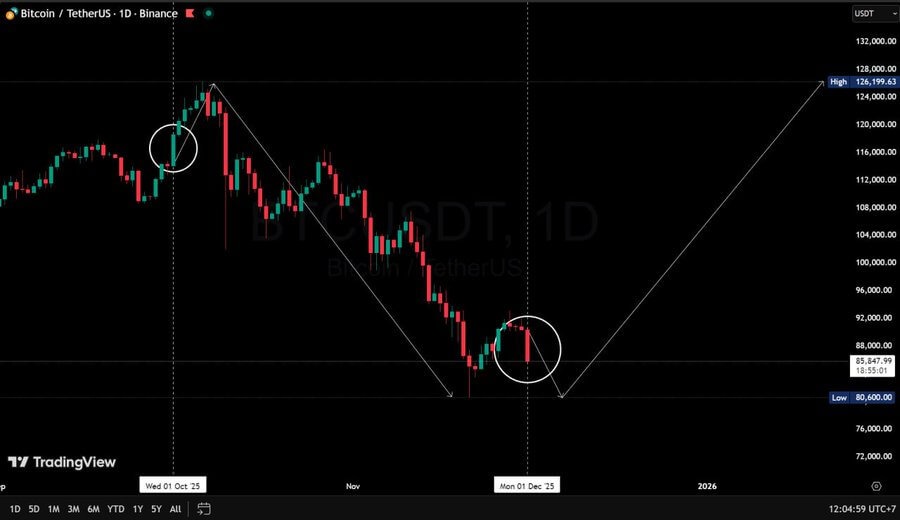
The Bitcoin price chart reveals a repeating multi-year structure with two prominent accumulation phases. From 2013 to 2017, prices advanced in stepwise fashion while respecting the ascending trendline, culminating in compressed monthly candles by late 2016 that preceded a sharp upward expansion. The ongoing phase since 2019 echoes this, forming a similar staircase pattern with pullbacks halting near the support line.
Green markers on analytical charts highlight instances where monthly candles resumed upward trajectories, while red markers denote temporary cooling periods during rallies. The recent monthly breakdown aligns closely with the orange support trendline, replicating the curved base observed in the prior cycle. Each accumulation box spans comparable durations and features a mid-cycle breakdown followed by recovery, underscoring the pattern’s consistency.
🚨 NOVEMBER MONTHLY CANDLE CLOSED with a BREAKDOWN 🚨$BTC/monthly #Bitcoin is likely to move along the support trendline after this monthly candle breakdown.
This pattern mirrors late 2016 and early 2017, where a massive bullish pump followed 🚀 pic.twitter.com/JAioqszvhL
— Trader Tardigrade (@TATrader_Alan) December 1, 2025
The slope of the current trendline parallels the earlier cycle, and monthly candle spacing suggests building momentum. Coinglass data reveals $358.26 million in net outflows on December 1, contributing to November’s sell pressure. However, price action has prioritized liquidity over sentiment, limiting the impact of external commentary.
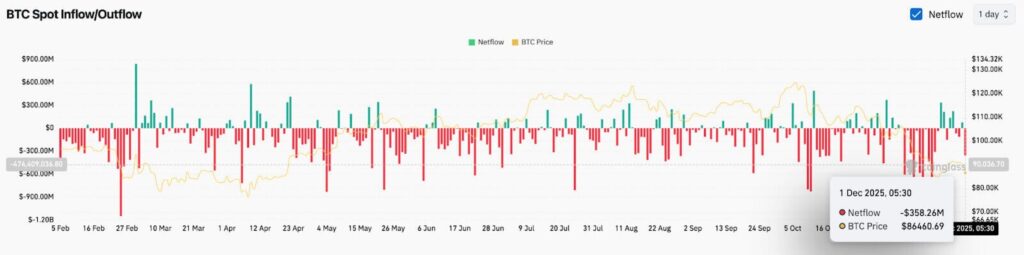
Source: Coinglass
Frequently Asked Questions
What Are the Key Support Levels for Bitcoin in the Near Term?
Bitcoin’s primary support zone lies between $84,000 and $82,000, essential for maintaining the long-term structure’s integrity. A daily close below $82,000 could lead toward $78,500, while holding this area supports potential recovery. Analysts emphasize these levels based on historical trendline interactions and recent market data.
Why Did Bitcoin Experience Recent Price Outflows?
Recent outflows totaling $358.26 million on December 1 stemmed from routine portfolio adjustments as new daily, weekly, and monthly candles formed. These resets created temporary sell pressure, but the core price structure near the long-term trendline remains resilient, much like patterns observed in past cycles.
Key Takeaways
- Long-Term Trendline Integrity: Bitcoin’s adherence to its ascending support line since 2013 indicates a stable multi-year framework, with current levels at $86,704 testing this resilience.
- Historical Pattern Repetition: The 2019–2025 accumulation phase mirrors the 2013–2017 cycle, including mid-cycle breakdowns that historically led to upward expansions.
- Actionable Levels: Monitor $84,000–$82,000 for support confirmation; a break above $92,100 may trigger bullish momentum toward $104,000.
Conclusion
Bitcoin’s long-term trendline continues to anchor its price action in 2025, with the current pattern closely resembling the 2016-2017 setup that fueled substantial gains. Key support at $84,000–$82,000 and observed momentum signals suggest potential for a rebound if structure holds. As market dynamics evolve, investors should track these levels closely for informed positioning in the evolving cryptocurrency landscape.
Key Levels Show Near-Term Direction
Experts highlight that Bitcoin must defend the $84,000 to $82,000 range to preserve overall stability. Surpassing $92,100 would overcome the initial EMA resistance, while closing above $98,103 could activate the Supertrend indicator, paving the way to $104,000 and beyond. These thresholds derive from technical analysis of recent candle formations and liquidity flows.
Source: GemDetector(X)
The $82,000 support is pivotal, as a breach could direct prices to $78,500 amid waning bids. Rebound prospects rise with incoming support and positive CVD readings, aligning with the broader trendline narrative.
Gem Detector’s analysis attributes the latest decline to standard rebalancing activities, reinforcing that Bitcoin is poised to navigate along the support trendline post-breakdown, akin to 2016-2017 dynamics. This perspective draws from comprehensive chart reviews by seasoned traders, emphasizing factual market behaviors over speculative narratives.
Add COINOTAG as a Preferred Source
Add COINOTAG to your preferred sources in Google News and Search to see our coverage first.
Add on GoogleRelated Tags
Comments
Other Articles
Coinbase (COIN) bounces 10%, Solana, LINK, SUI outperform as bitcoin (BTC) holds $80K
May 8, 2026 at 08:59 PM UTC
Zcash to add quantum-recoverable wallets within a month, go post-quantum by 2027
May 8, 2026 at 09:08 AM UTC
The great derivatives disconnect: Why 'negative' funding is actually a bullish signal for Bitcoin
May 7, 2026 at 03:50 PM UTC